> ## Documentation Index
> Fetch the complete documentation index at: https://docs.sonarx.com/llms.txt
> Use this file to discover all available pages before exploring further.
# Token Metrics
> Gain holistic insights into token performance and usage statistics, including volume, transfers, and user count
Token Metrics moves beyond simple price data to look at how assets are actually being used.
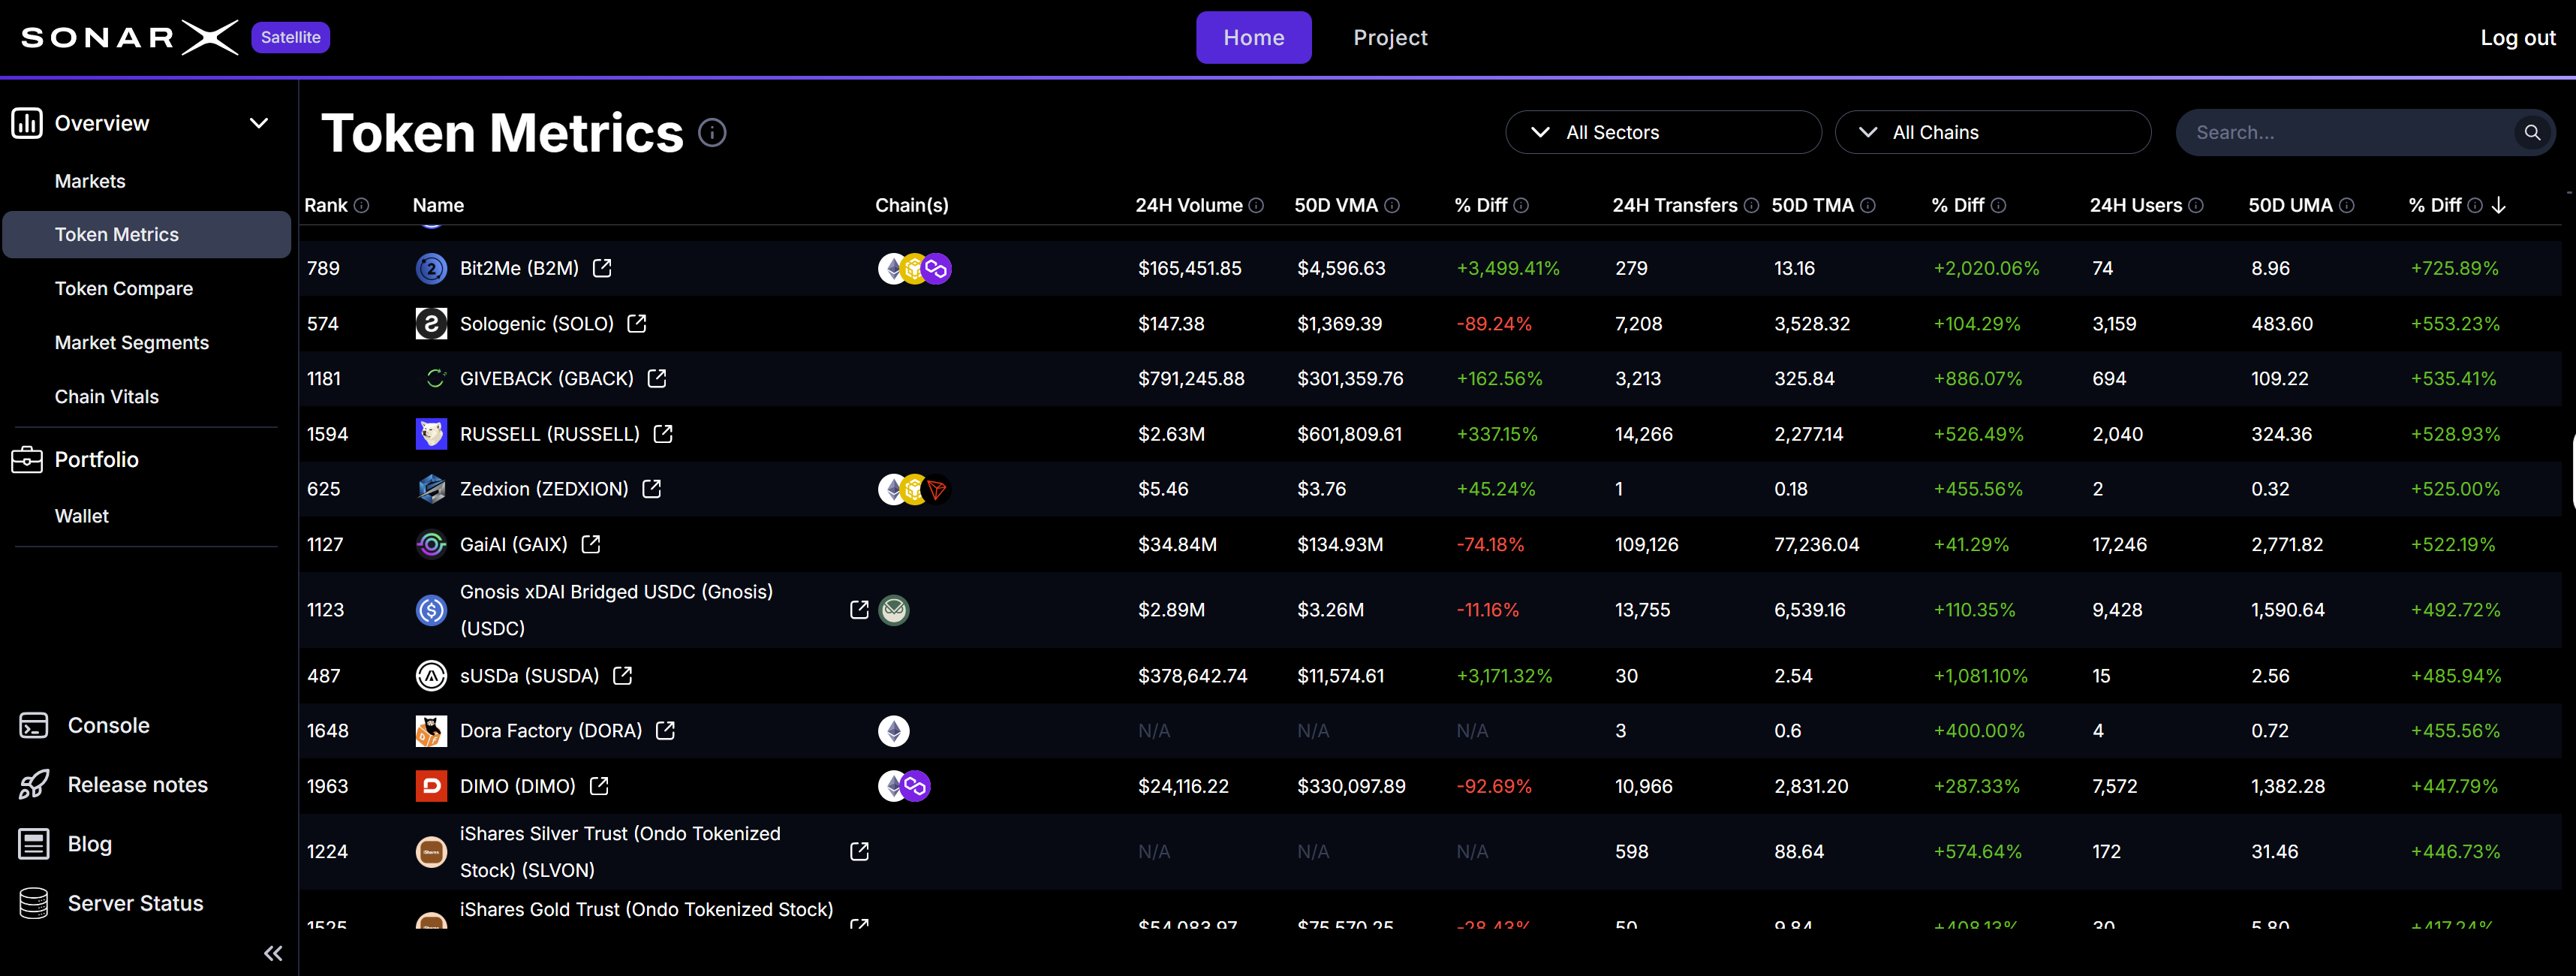 This section provides a holistic view of performance through three key data points: volume, transfers, and user counts. These metrics are aggregated across all 120+ chains we support. This gives you a true picture of the total activity for any token.
We use a 50-day moving average (50D VMA) to provide context for these numbers. This allows you to compare current activity to the historical norm. If the 24-hour volume is much higher than the 50-day average, you know a major event is happening. We also track the "Percent Difference" for each metric. This shows exactly how much activity has increased or decreased relative to the moving average.
This section provides a holistic view of performance through three key data points: volume, transfers, and user counts. These metrics are aggregated across all 120+ chains we support. This gives you a true picture of the total activity for any token.
We use a 50-day moving average (50D VMA) to provide context for these numbers. This allows you to compare current activity to the historical norm. If the 24-hour volume is much higher than the 50-day average, you know a major event is happening. We also track the "Percent Difference" for each metric. This shows exactly how much activity has increased or decreased relative to the moving average.
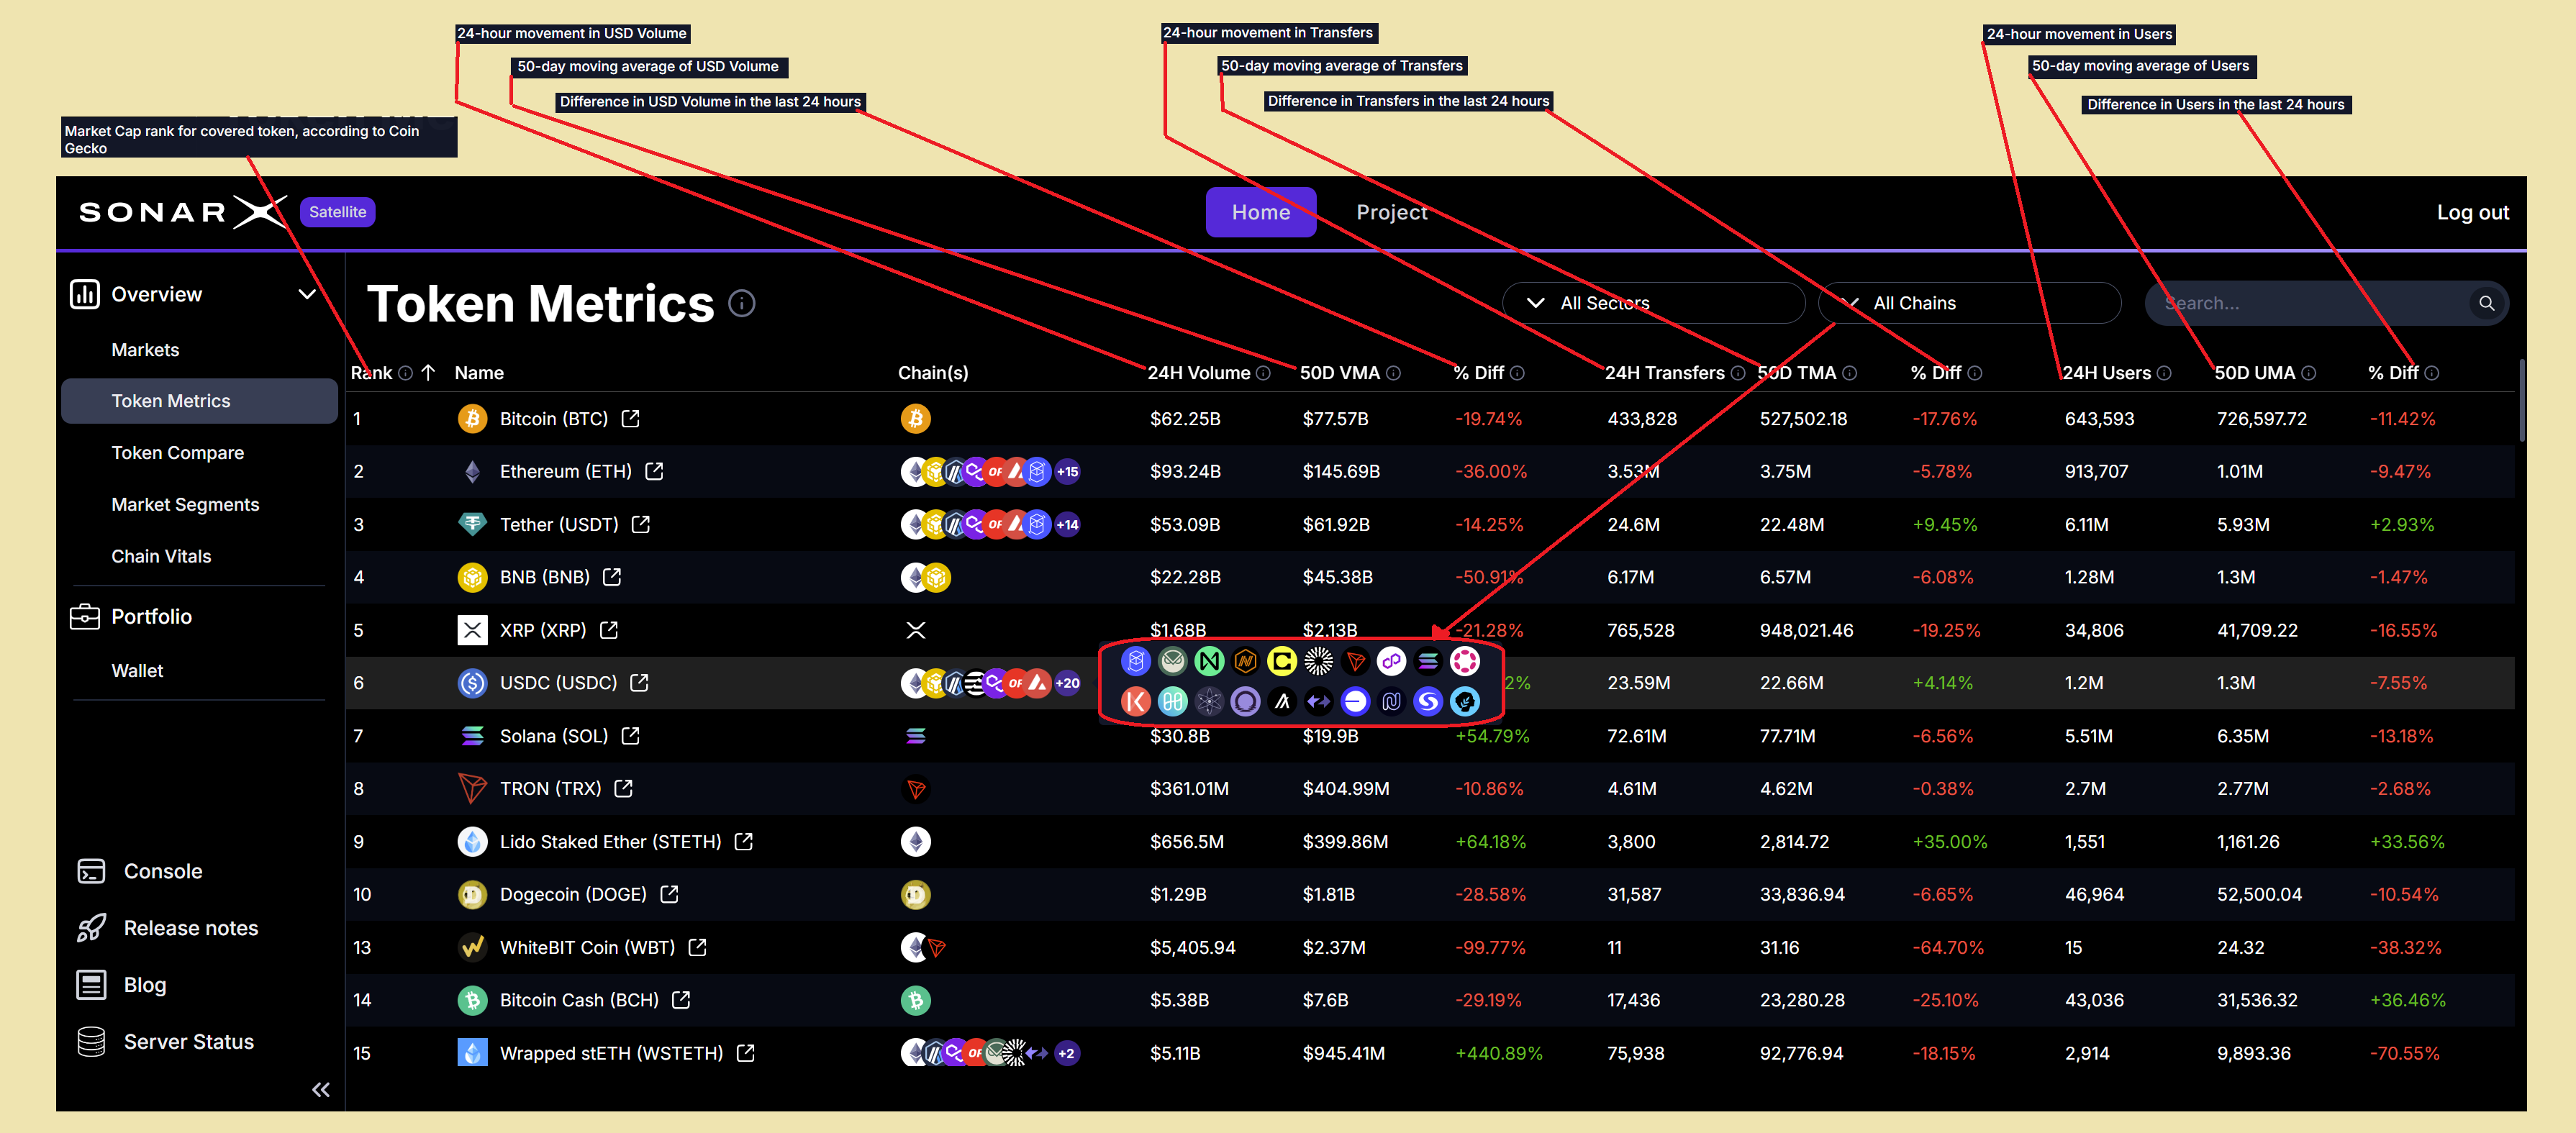 This comparison is helpful for finding outliers. Sometimes a token might have high volume but very few transfers. Other times, the number of users might spike while the volume stays the same. These patterns can signal a change in market sentiment before the price reacts. It is an effective way to separate real growth from temporary spikes.
The data is ranked by market value. This helps you stay focused on the most influential assets. You can see the 24-hour USD volume and the average volume side-by-side. This level of detail is usually only available to people who can write their own database queries. Satellite brings this intelligence to your screen in a simple and readable format.
You can click the column heading to change the sorting (Asc./Desc.).
## Easy filtering for finding, comparing, slicing\&dicing, and focusing
By default, the Satellite Token Metrics page displays all tokens across all supported chains. Users can easily and quickly perform focused searches and analyses by using the available filters: Chains and DACS classification.
### Filter by Chain
To filter for assets supported on an individual chain, or conversely across all chains, users can simply click on the chain drop-down and select what chain they want to filter by (for example: Arbitrum):
This comparison is helpful for finding outliers. Sometimes a token might have high volume but very few transfers. Other times, the number of users might spike while the volume stays the same. These patterns can signal a change in market sentiment before the price reacts. It is an effective way to separate real growth from temporary spikes.
The data is ranked by market value. This helps you stay focused on the most influential assets. You can see the 24-hour USD volume and the average volume side-by-side. This level of detail is usually only available to people who can write their own database queries. Satellite brings this intelligence to your screen in a simple and readable format.
You can click the column heading to change the sorting (Asc./Desc.).
## Easy filtering for finding, comparing, slicing\&dicing, and focusing
By default, the Satellite Token Metrics page displays all tokens across all supported chains. Users can easily and quickly perform focused searches and analyses by using the available filters: Chains and DACS classification.
### Filter by Chain
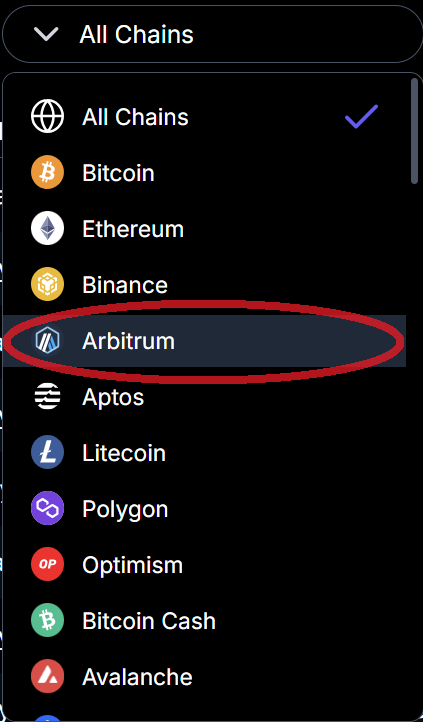
To filter for assets supported on an individual chain, or conversely across all chains, users can simply click on the chain drop-down and select what chain they want to filter by (for example: Arbitrum):
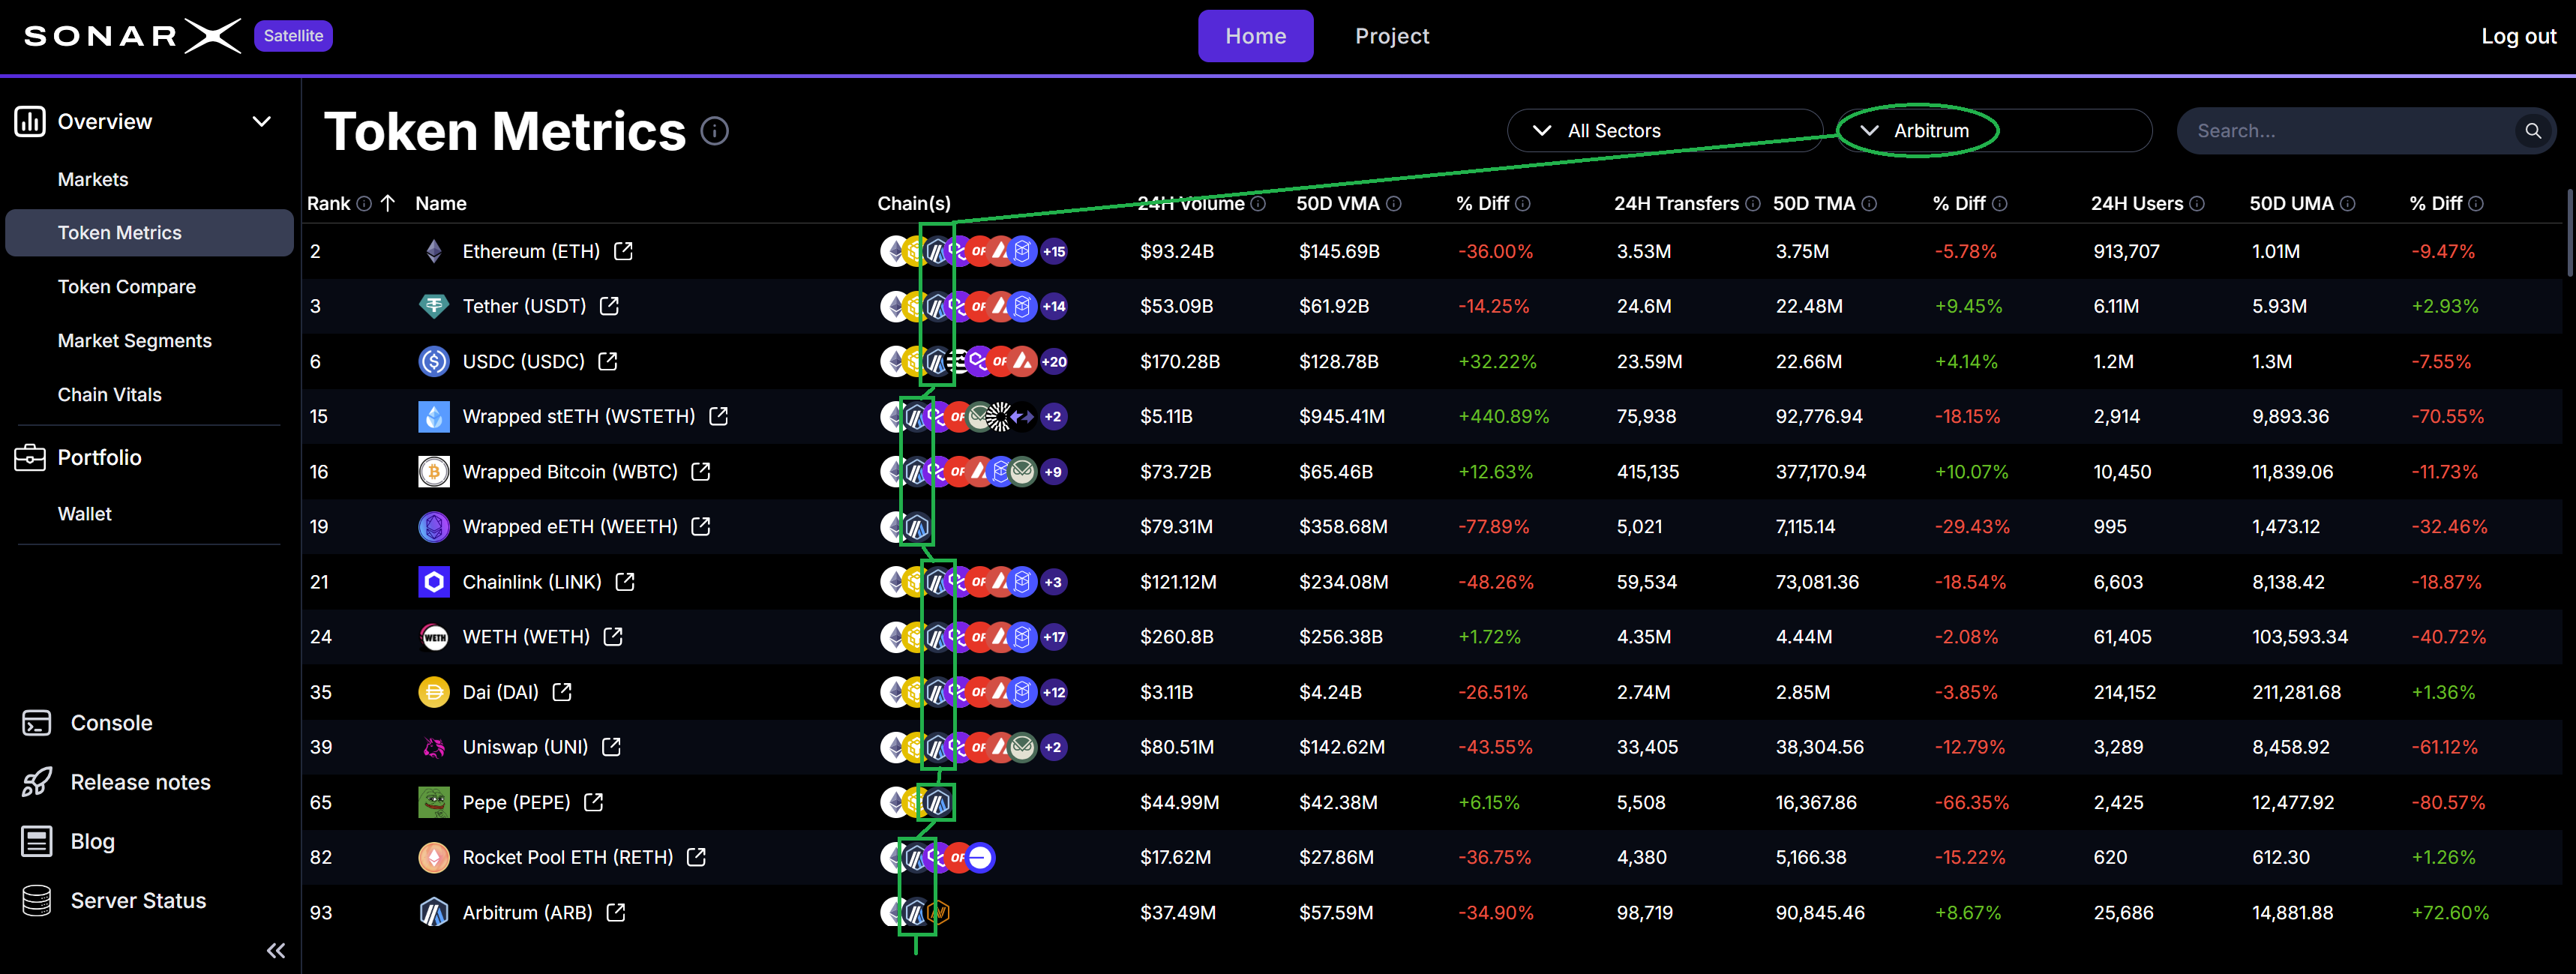
 Satellite will now display only the assets that are available on the selected chain (Arbitrum):
 ### Filter by DACS Sector / Industry Group / Industry
To filter for assets that DACS classifies in a specific Sector, Industry Group, or Industry, users can click the classification drop-down, select the level at which to apply the filter, and choose the particular value (at that level) they want to use:
### Filter by DACS Sector / Industry Group / Industry
To filter for assets that DACS classifies in a specific Sector, Industry Group, or Industry, users can click the classification drop-down, select the level at which to apply the filter, and choose the particular value (at that level) they want to use:
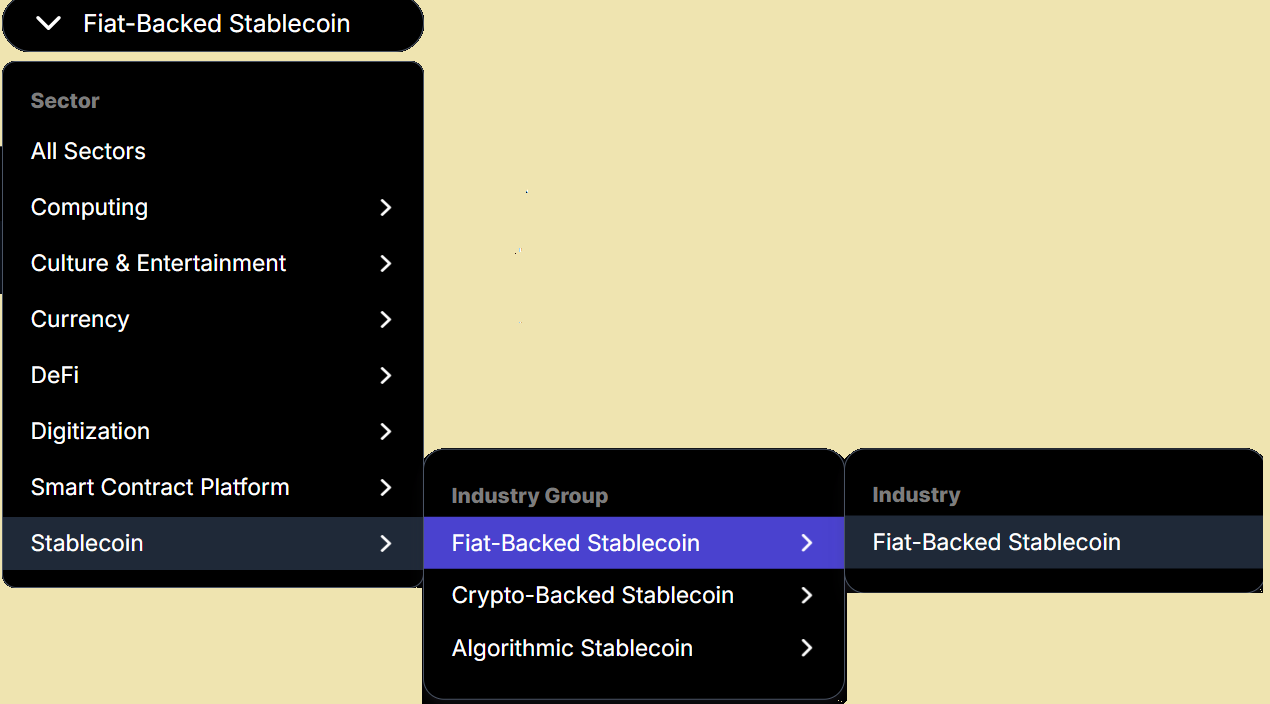 As we had previously also filtered by Chain = Arbitrum, Satellite now shows all assets that are available on Arbitrum AND whose DACS' Industry group is Fiat-Backed Stablecoin:
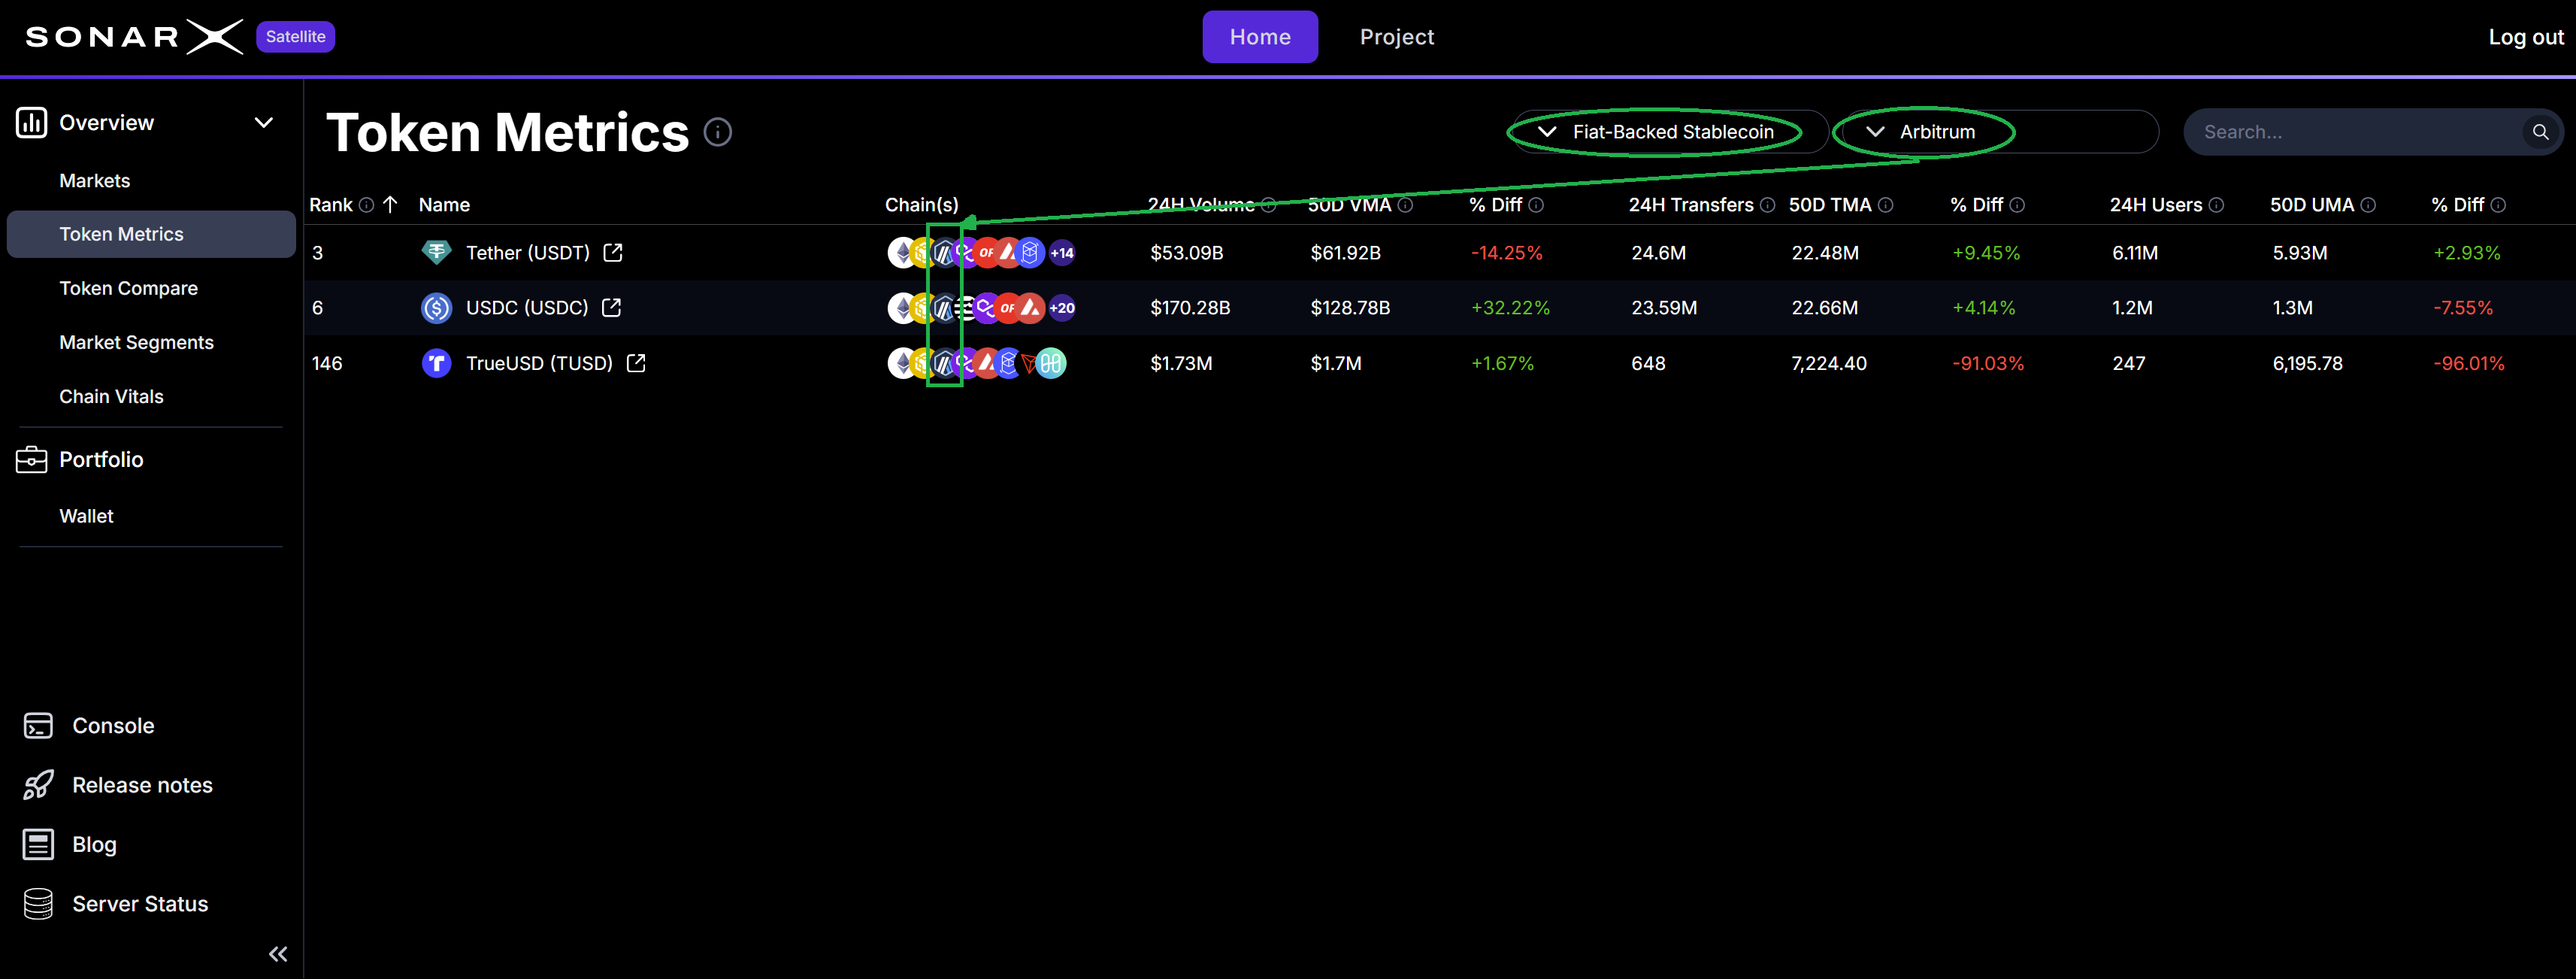
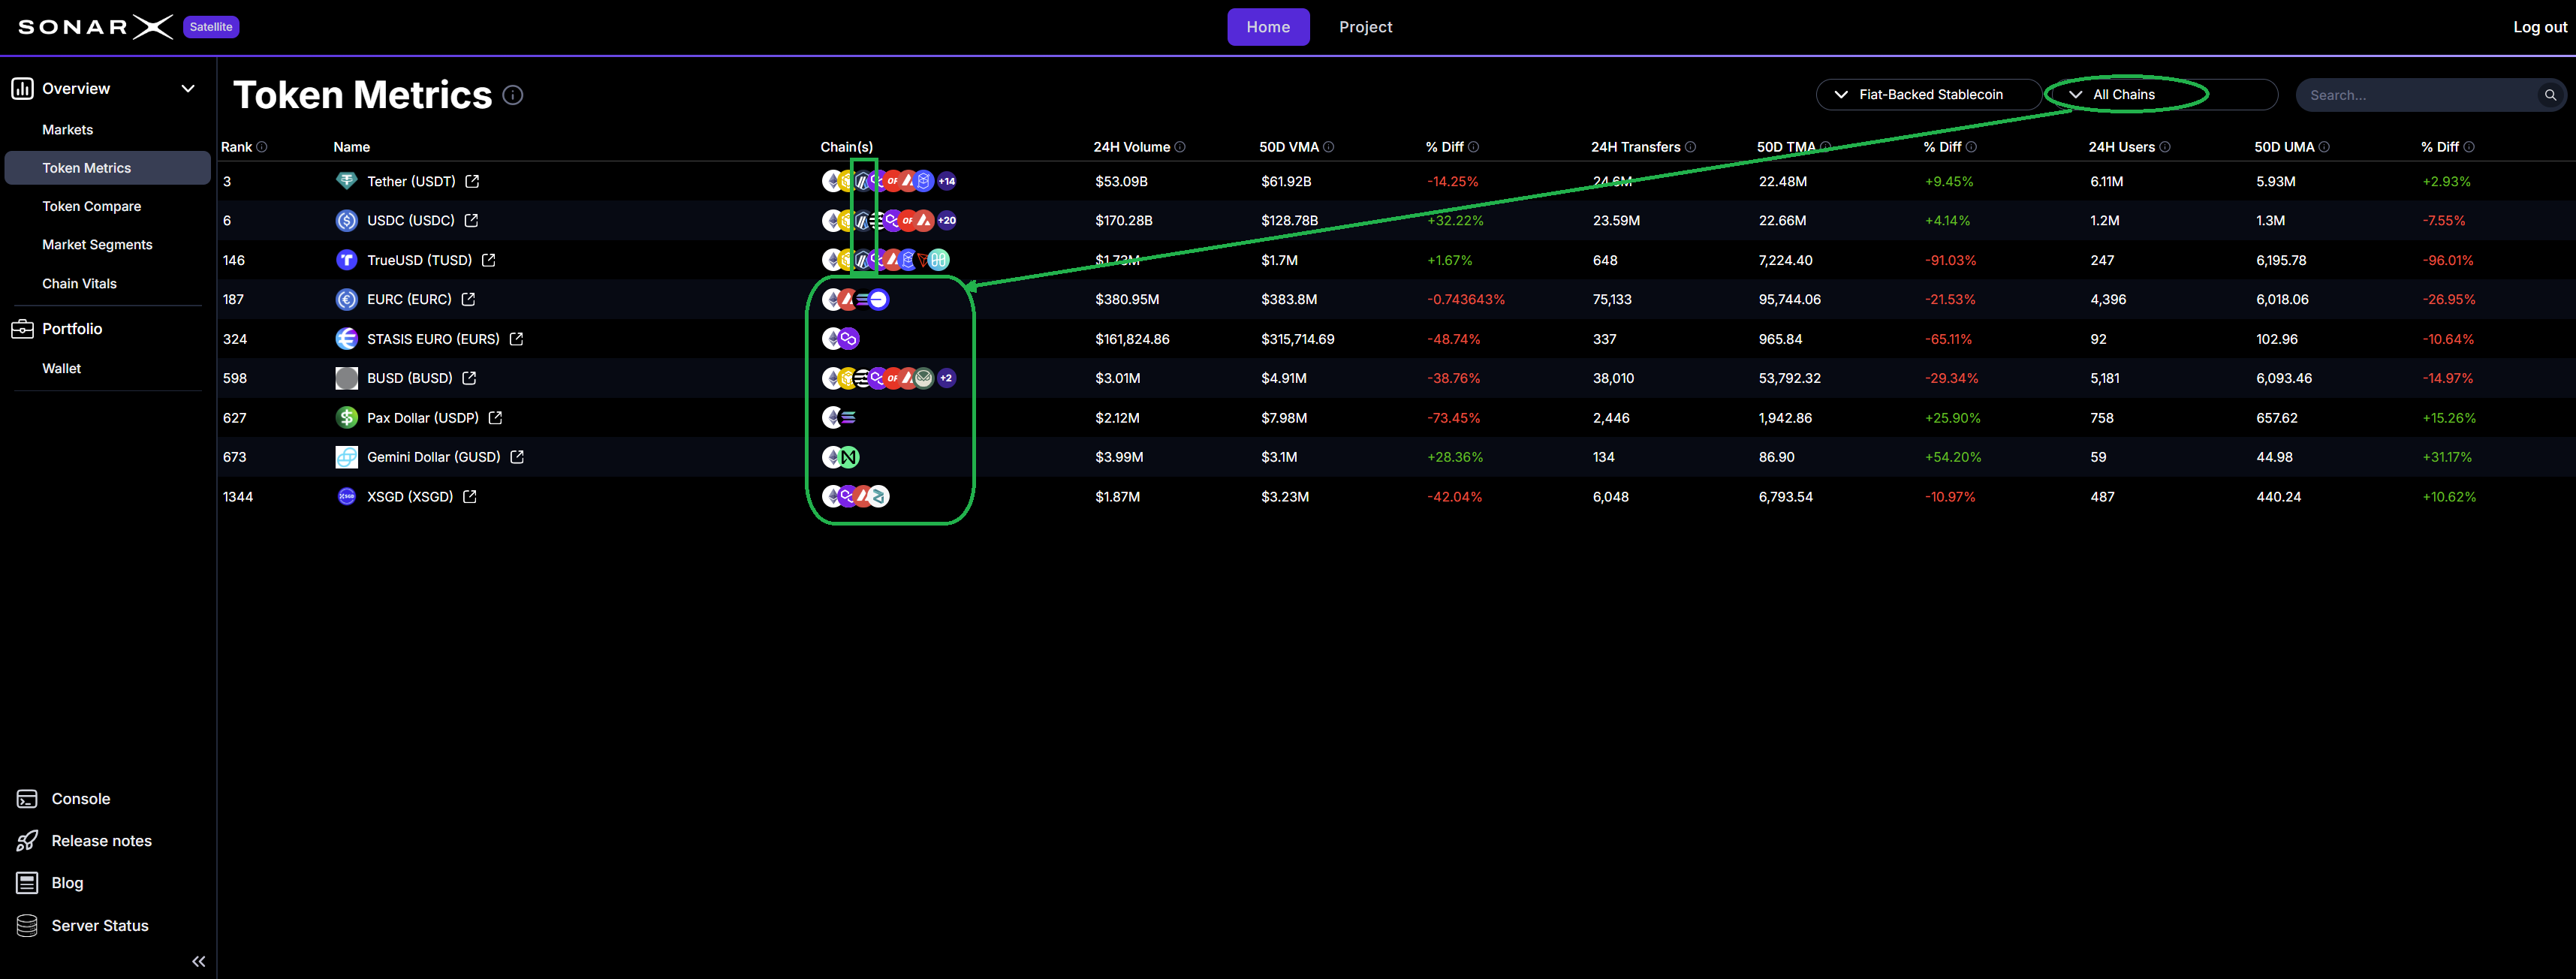
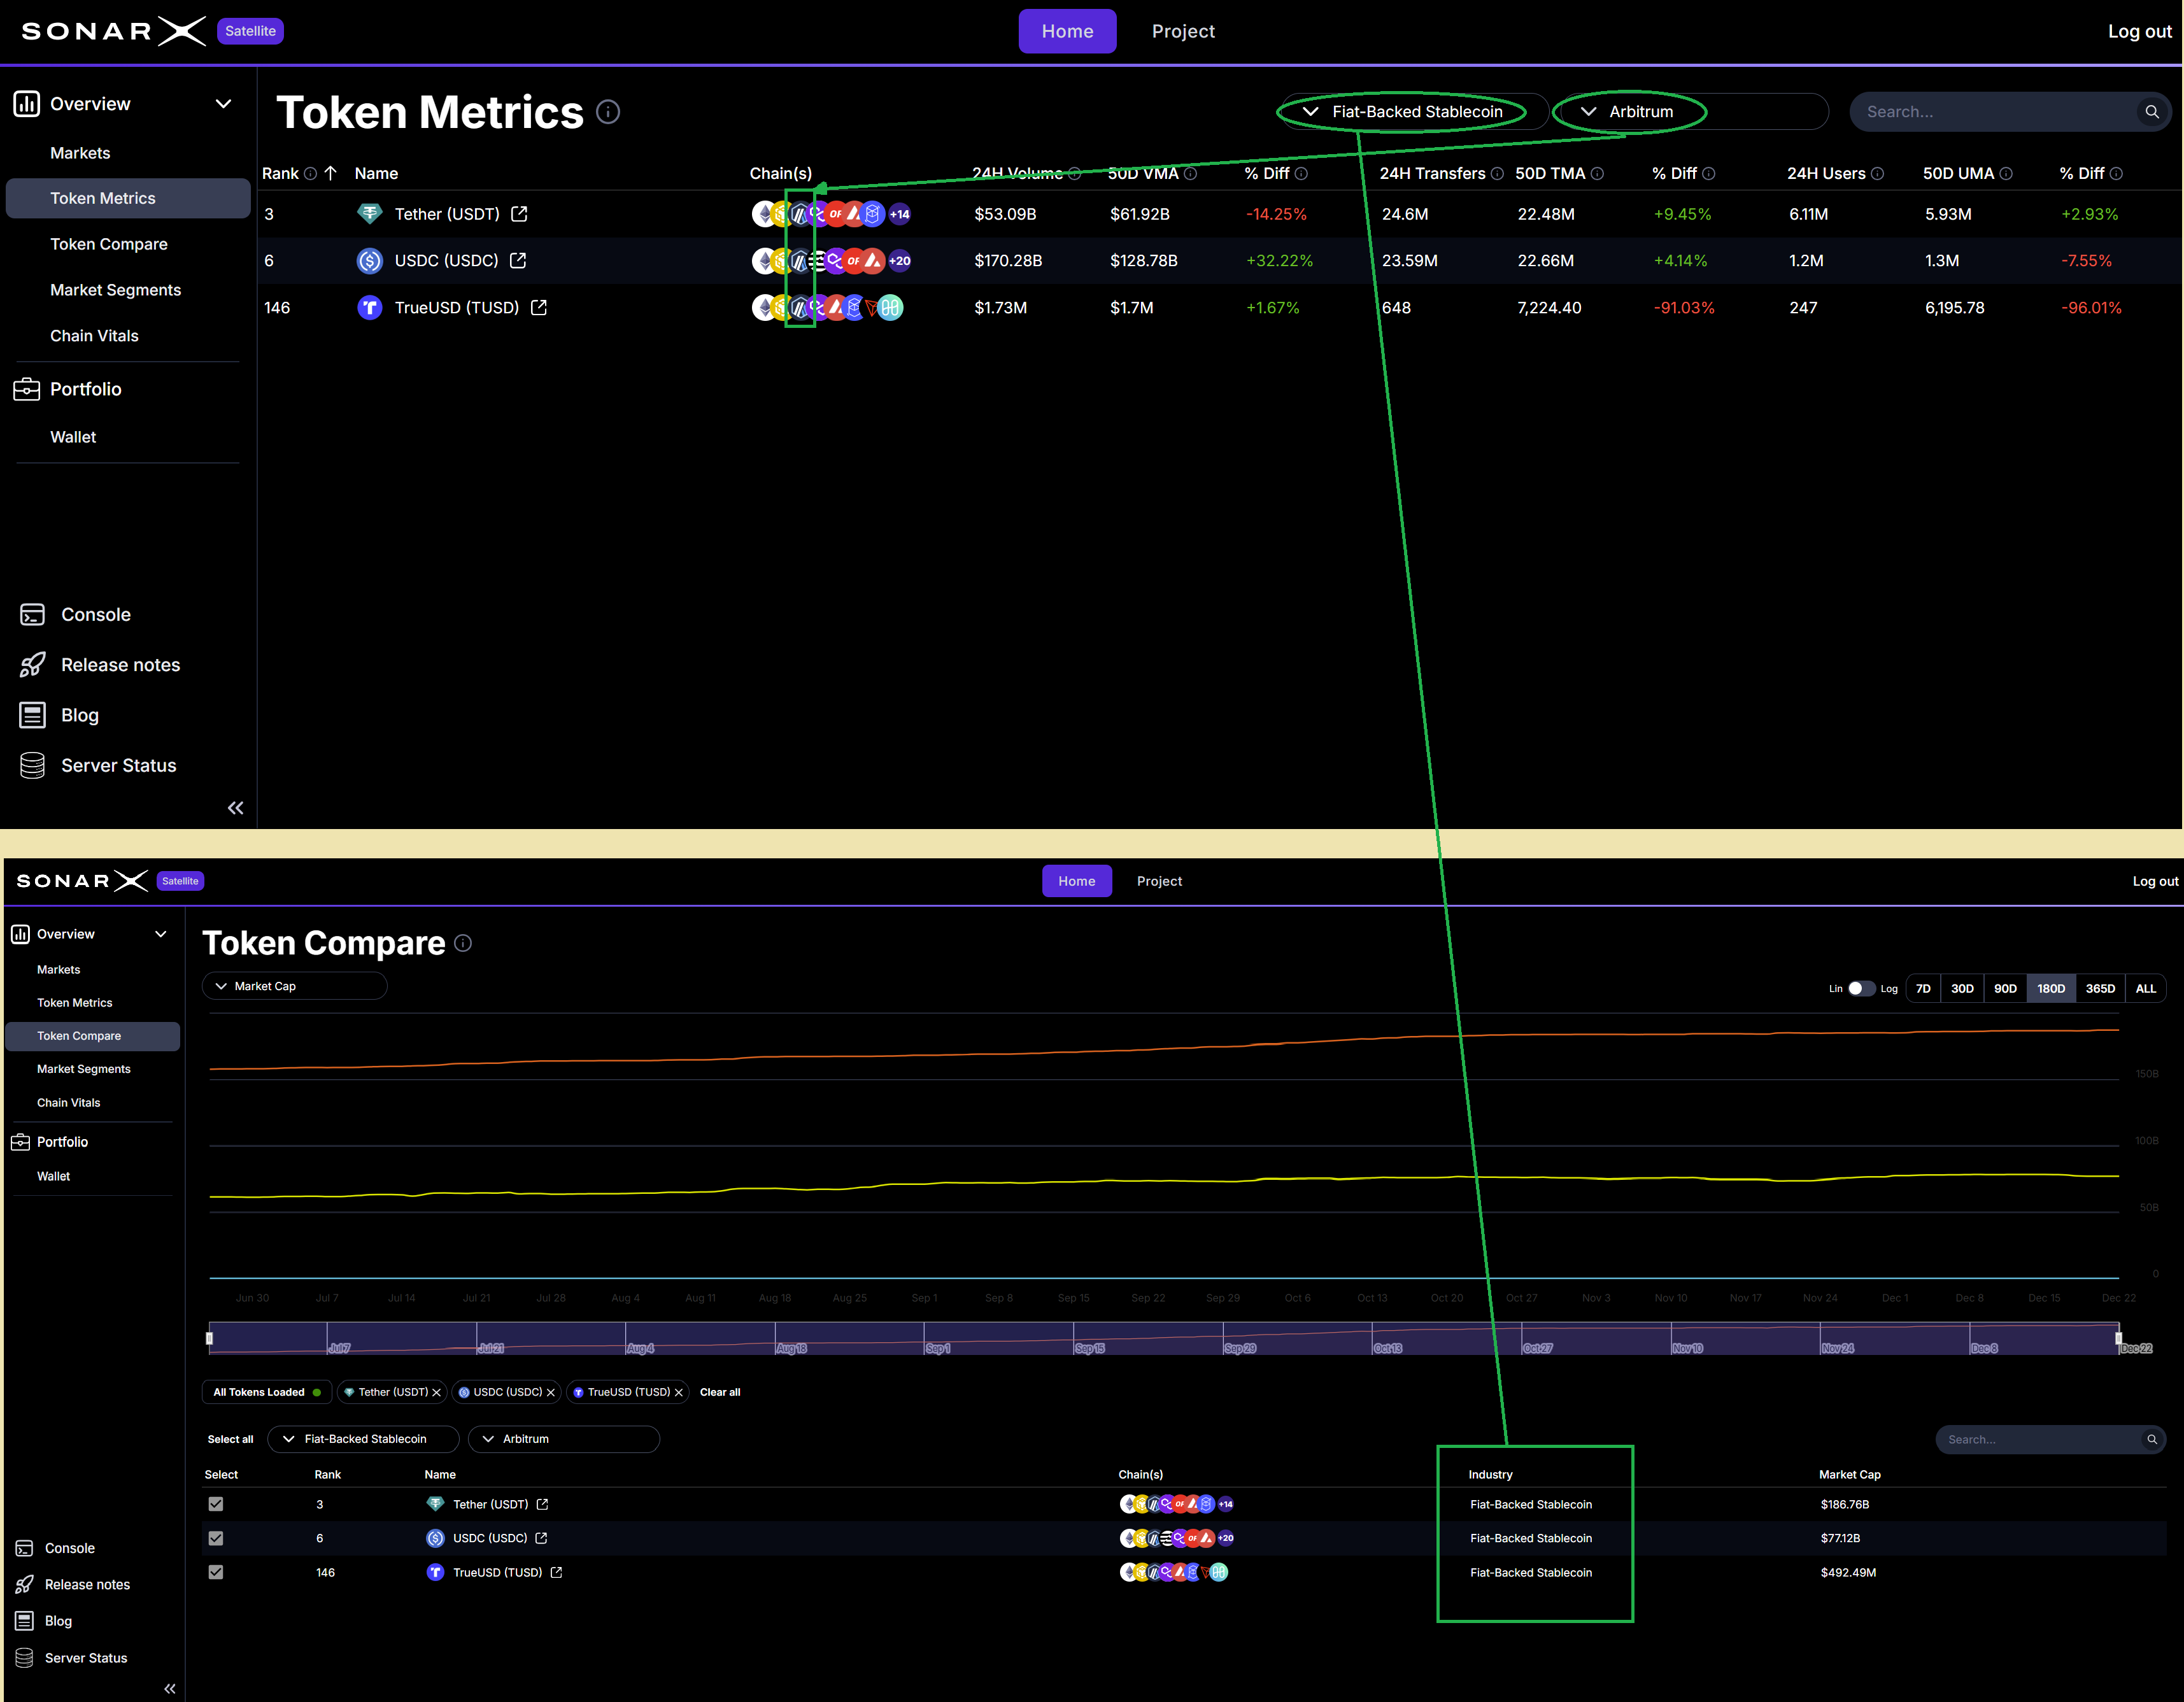 If users want to look at all assets whose DACS' Industry Group = Fiat-Backed Stablecoin across All Chains, they can simply remove the filter by Chain = Arbitrum, and select instead Chain = All Chains:
 ### **Focus on a single asset (token)**
At any point in time, users can click on one of the displayed assets to launch the "**Project**" view, where they can access in-depth information for the selected asset. See more details in the [dedicated section for the Project page](/Satellite/analytics/project).
### **Focus on a single asset (token)**
At any point in time, users can click on one of the displayed assets to launch the "**Project**" view, where they can access in-depth information for the selected asset. See more details in the [dedicated section for the Project page](/Satellite/analytics/project).