> ## Documentation Index
> Fetch the complete documentation index at: https://docs.sonarx.com/llms.txt
> Use this file to discover all available pages before exploring further.
# Overview
> An analytics platform that provides real-time insights into digital assets, including chains, tokens, projects, and wallets. Plus a section dedicated to Hyperliquid Core flow data and professional charting.
Satellite is your one-stop platform to track, monitor, compare, and investigate Markets, Chains, Tokens, and Wallets based on preset metrics and according to the Digital Asset Classification Standard (DACS)'s taxonomy. Satellite allows you to visualize blockchain data across multiple dimensions, aggregation buckets, and all covered chains, through interactive charts.
 Satellite is the premier visualization interface for the SonarX data ecosystem. It was first built as a demonstration tool to display the depth of our historical blockchain records. Most platforms only offer a fragmented view of the market. They often force you to look at one chain at a time. Satellite solves this by providing a **unified, cross-chain perspective**. It serves as a central hub where **users can inspect tokens, monitor wallets, and analyze market trends without writing any code**.
The platform relies on the same high-quality data that feeds our Full Historical Dataset and our enterprise APIs. This includes full historical records from the genesis block to the most recent finalized block. We cover over 120 chains, including both public and private environments. **This broad coverage is helpful for tracking assets that move between different ecosystems**.
**The logic behind Satellite is to turn raw, difficult data into clear signals**. SonarX created Satellite to help people quickly find answers to their questions. For example, a user might notice a spike in activity on one chain and use Satellite to see how it affects the rest of the market. It is used by a variety of groups, including financial institutions, research teams, and government regulators.
The tool focuses on two main pillars: tokens and wallets. You can find a high-level summary of the entire market or focus on the behavior of a single address. Because it is built on top of our specialized big data engine, it can process massive datasets that would slow down a standard website. **Satellite is a place for discovery. It helps you see the story behind the numbers.**
## Query Engine
Satellite runs on our api to guarantee the fastest, most scalable queries and analytics. Because "slow" is the only unavailable option...
## Supported Chains
Access comprehensive blockchain data across 120+ **blockchains** (same as the Full Historical Stream). View all supported chains on the [supported blockchains page](/datasets/chaincoverage) .
## Features
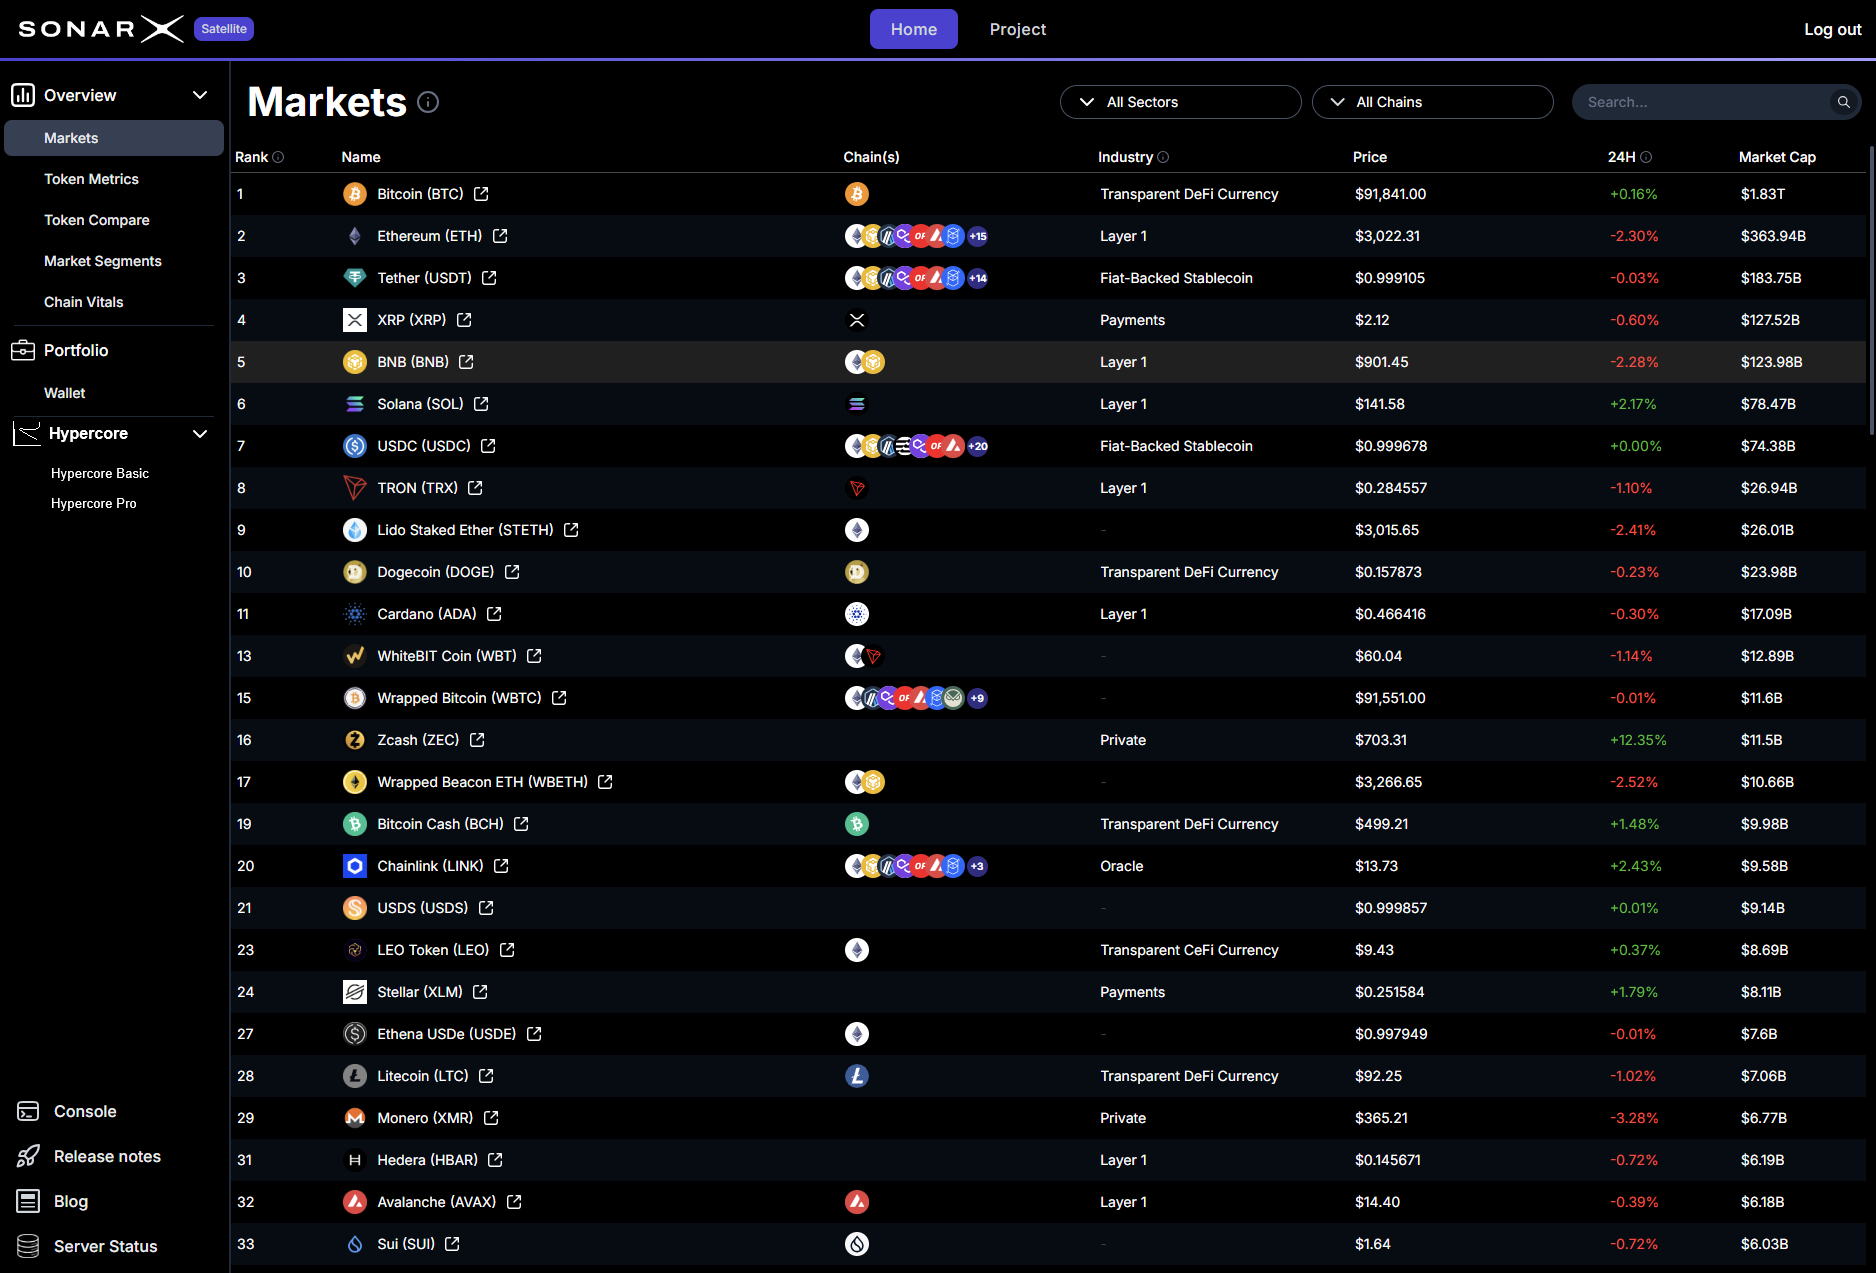
Overview of Tokens for SonarX supported chains covering the top 2,000 tokens by market capitalization according to CoinGecko
Gain holistic insights into token performance and usage statistics, including volume, transfers, and user count.
Compare on-chain metrics such as Market Cap, Exchange Volume, and Moving Average across up to 10 chains.
Categorical view of metrics for each sector, segmented by industry group.\
Segments are based on CoinDesk's DACS (Digital Asset Classification Standard) 500 represents the top 500 digital assets by market capitalization.
Track and compare key metrics by Chain (Volumes, Transactions, Transfers, Unique Users) and by Asset (Volumes, Transfers, Unique Users)
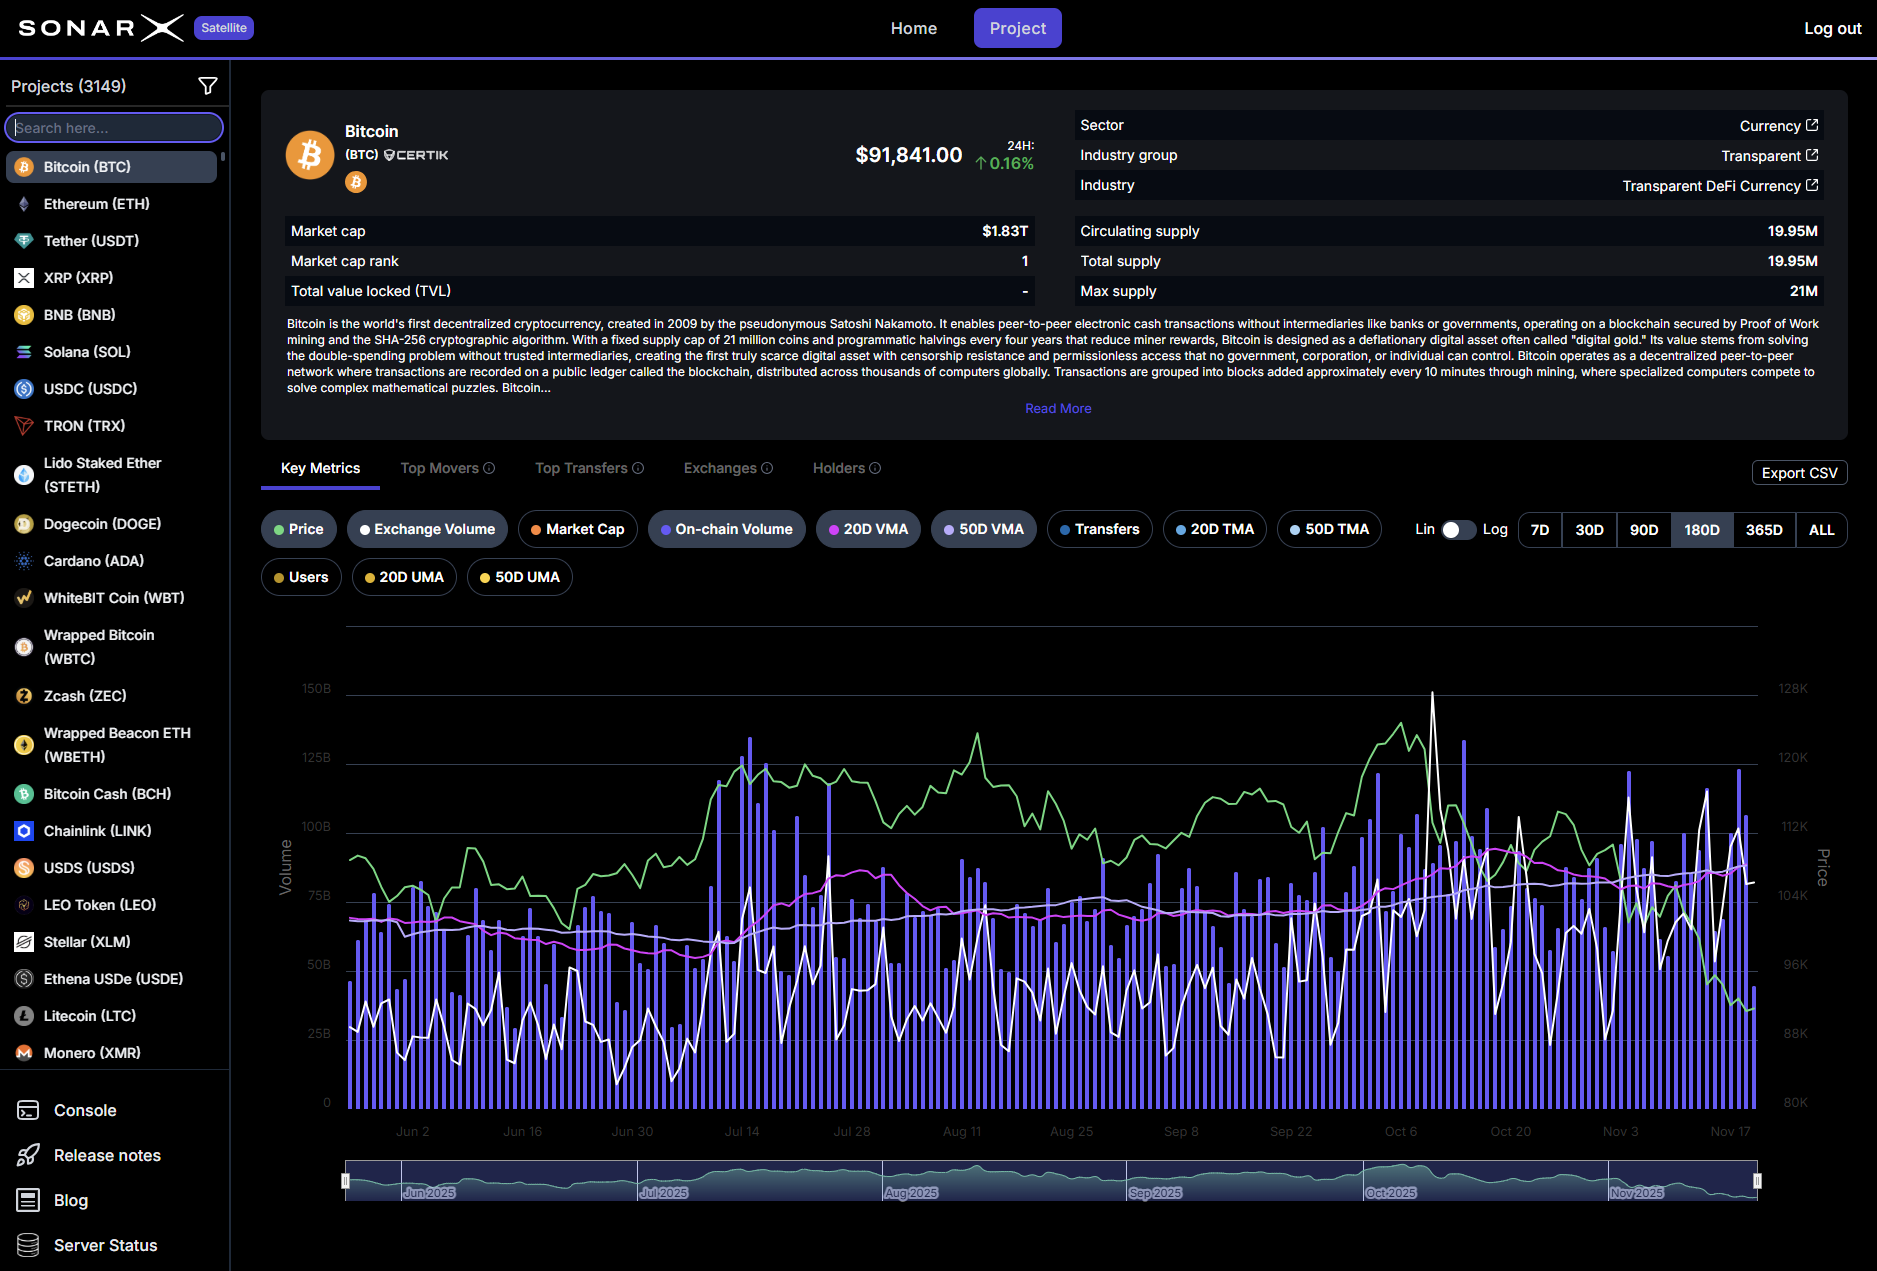
In-depth view of each Token (Market Cap, TVL, Supply, Unique Users) with its Key metrics, Top Movers, Top Transfers, Exchanges, and Holders.
Build and monitor customizable wallet portfolios using personalized labels
Holdings, Top Transfers, Token Flow, and Counterparties for any Wallet on the supported chains
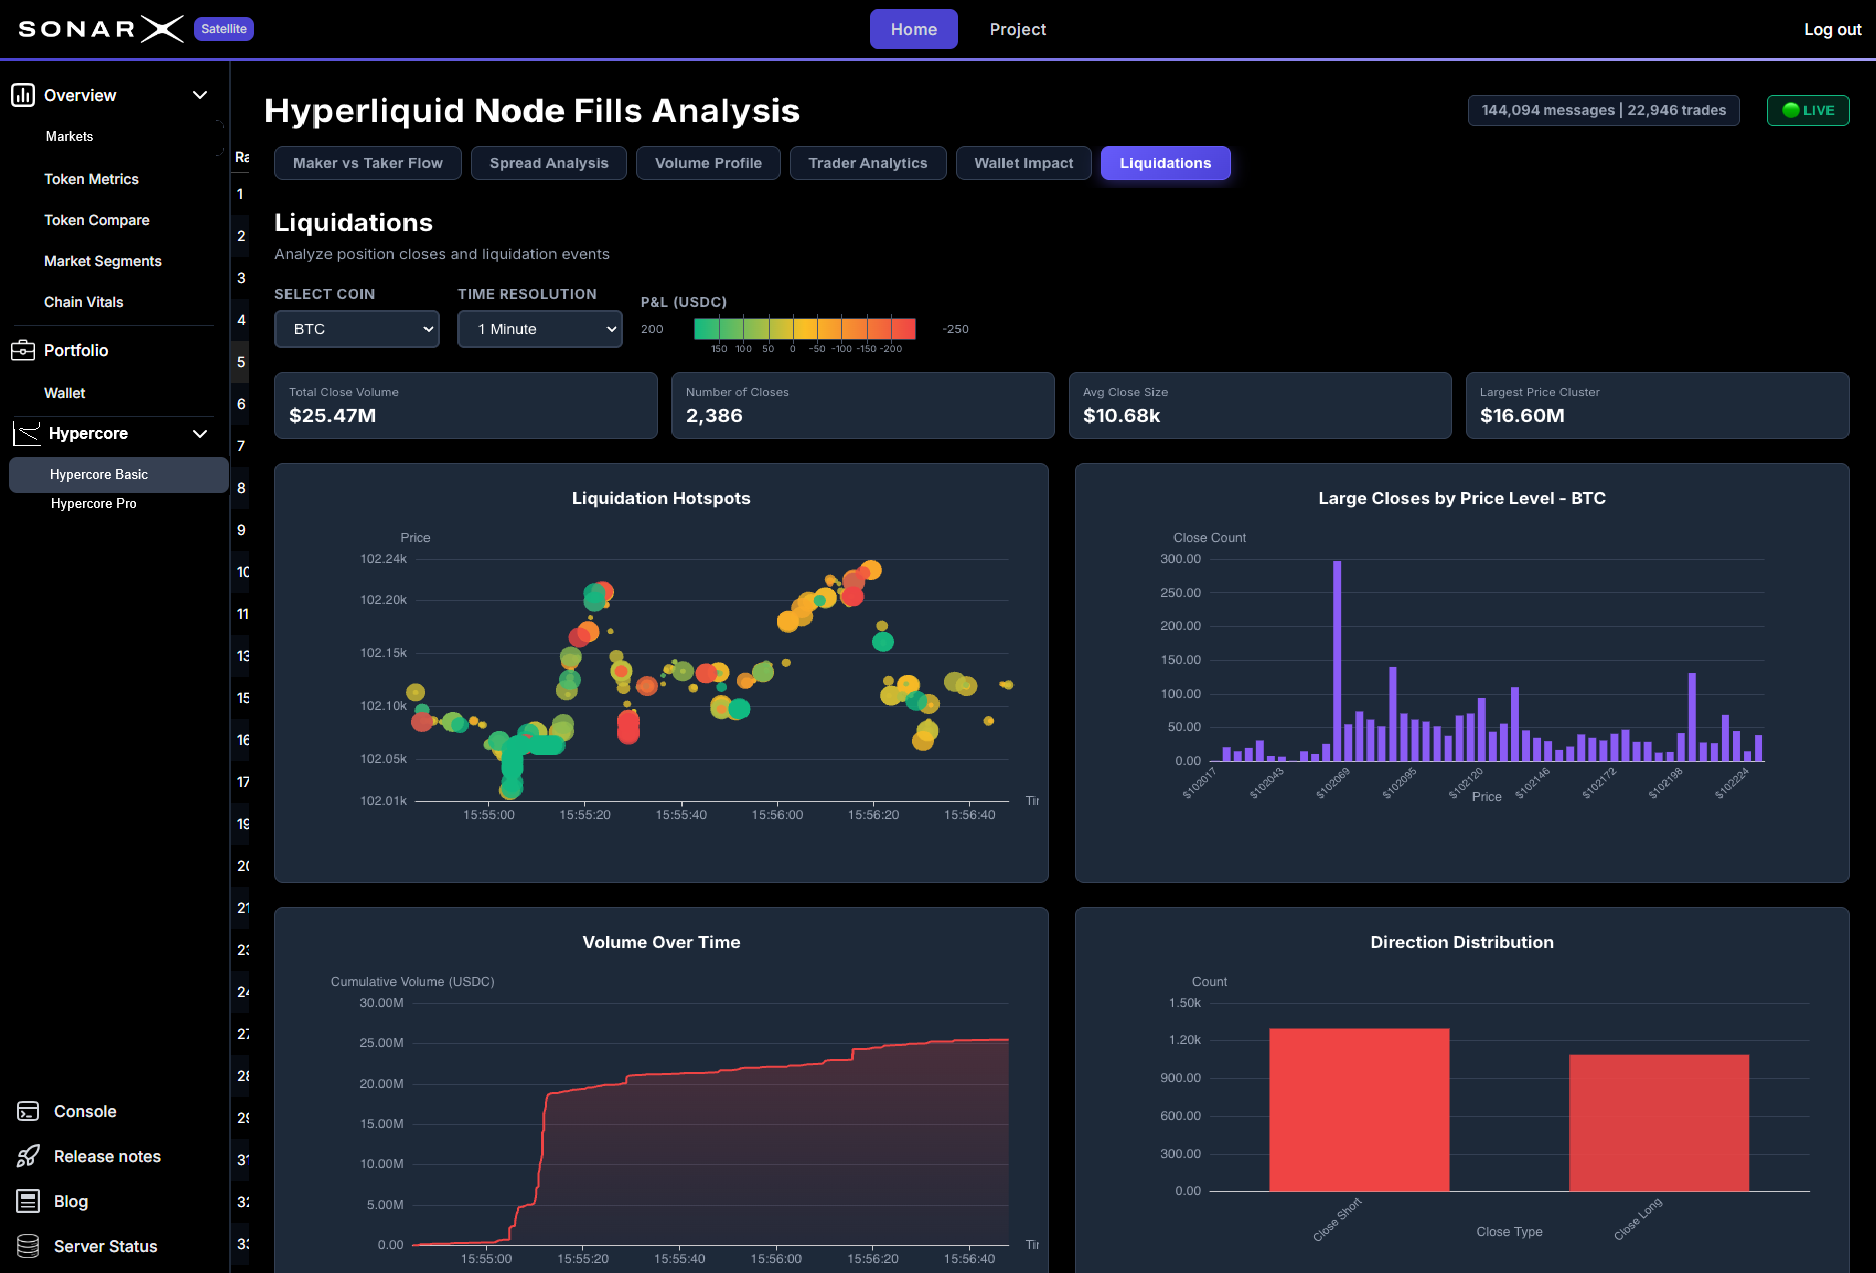
Hypercore flow analytics with low latency (\<1s) and standard graphics
Full Hypercore books (L2, L3, L4) with Ultra-Low Latency (\<150ms) and professional trading charts
Satellite is the premier visualization interface for the SonarX data ecosystem. It was first built as a demonstration tool to display the depth of our historical blockchain records. Most platforms only offer a fragmented view of the market. They often force you to look at one chain at a time. Satellite solves this by providing a **unified, cross-chain perspective**. It serves as a central hub where **users can inspect tokens, monitor wallets, and analyze market trends without writing any code**.
The platform relies on the same high-quality data that feeds our Full Historical Dataset and our enterprise APIs. This includes full historical records from the genesis block to the most recent finalized block. We cover over 120 chains, including both public and private environments. **This broad coverage is helpful for tracking assets that move between different ecosystems**.
**The logic behind Satellite is to turn raw, difficult data into clear signals**. SonarX created Satellite to help people quickly find answers to their questions. For example, a user might notice a spike in activity on one chain and use Satellite to see how it affects the rest of the market. It is used by a variety of groups, including financial institutions, research teams, and government regulators.
The tool focuses on two main pillars: tokens and wallets. You can find a high-level summary of the entire market or focus on the behavior of a single address. Because it is built on top of our specialized big data engine, it can process massive datasets that would slow down a standard website. **Satellite is a place for discovery. It helps you see the story behind the numbers.**
## Query Engine
Satellite runs on our api to guarantee the fastest, most scalable queries and analytics. Because "slow" is the only unavailable option...
## Supported Chains
Access comprehensive blockchain data across 120+ **blockchains** (same as the Full Historical Stream). View all supported chains on the [supported blockchains page](/datasets/chaincoverage) .
## Features
Overview of Tokens for SonarX supported chains covering the top 2,000 tokens by market capitalization according to CoinGecko
Gain holistic insights into token performance and usage statistics, including volume, transfers, and user count.
Compare on-chain metrics such as Market Cap, Exchange Volume, and Moving Average across up to 10 chains.
Categorical view of metrics for each sector, segmented by industry group.\
Segments are based on CoinDesk's DACS (Digital Asset Classification Standard) 500 represents the top 500 digital assets by market capitalization.
Track and compare key metrics by Chain (Volumes, Transactions, Transfers, Unique Users) and by Asset (Volumes, Transfers, Unique Users)
In-depth view of each Token (Market Cap, TVL, Supply, Unique Users) with its Key metrics, Top Movers, Top Transfers, Exchanges, and Holders.
Build and monitor customizable wallet portfolios using personalized labels
Holdings, Top Transfers, Token Flow, and Counterparties for any Wallet on the supported chains
Hypercore flow analytics with low latency (\<1s) and standard graphics
Full Hypercore books (L2, L3, L4) with Ultra-Low Latency (\<150ms) and professional trading charts