Satellite: Home
Satellite: Tokens
Satellite: Hypercore Basic
Query Engine
Satellite runs on our api to guarantee the fastest, most scalable queries and analytics. Because “slow” is the only unavailable option…Supported Chains
Access comprehensive blockchain data across 120+ blockchains (same as the Full Historical Stream). View all supported chains on the supported blockchains page .Features
- Analytics
- Portfolio
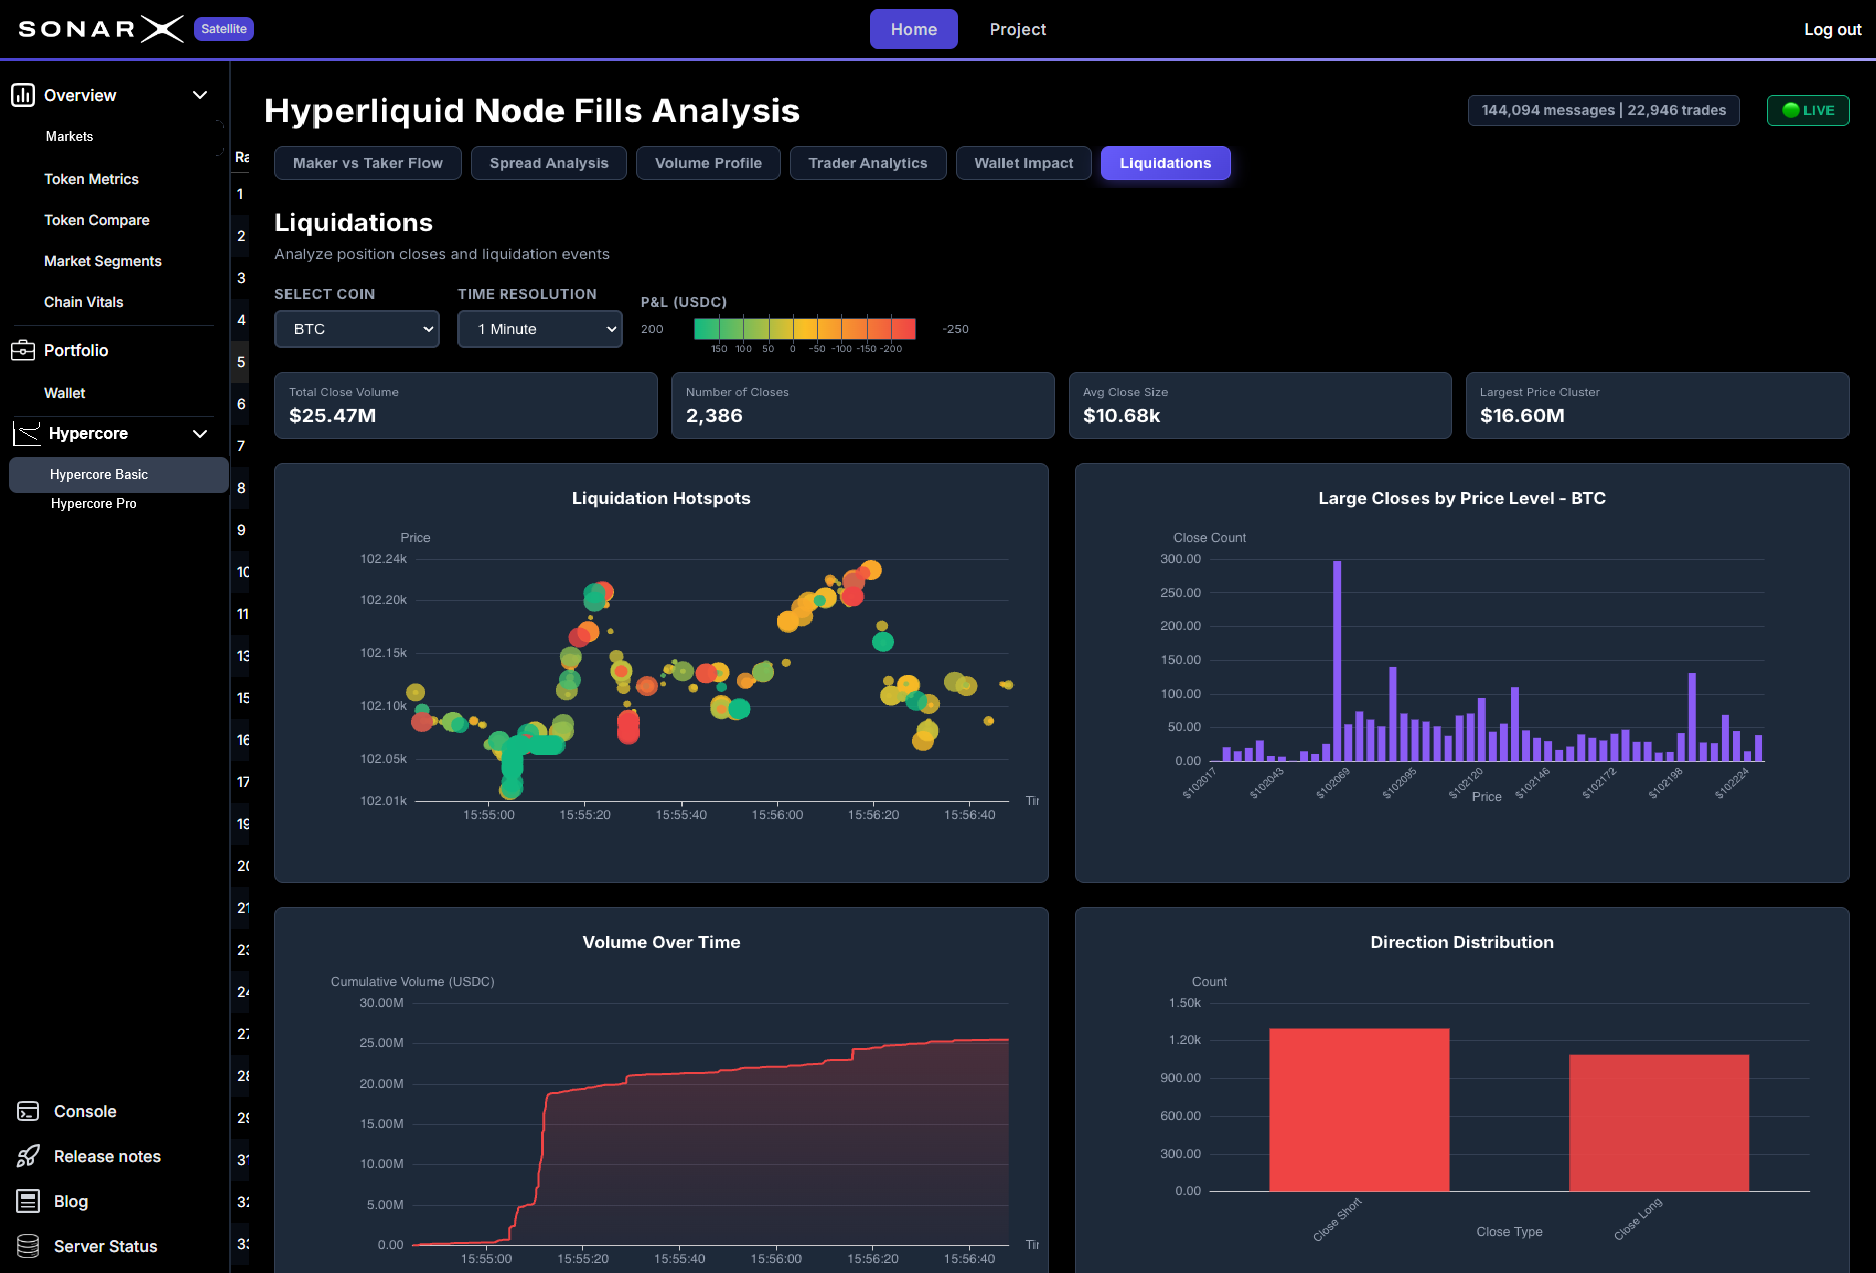
- Hyperliquid Core
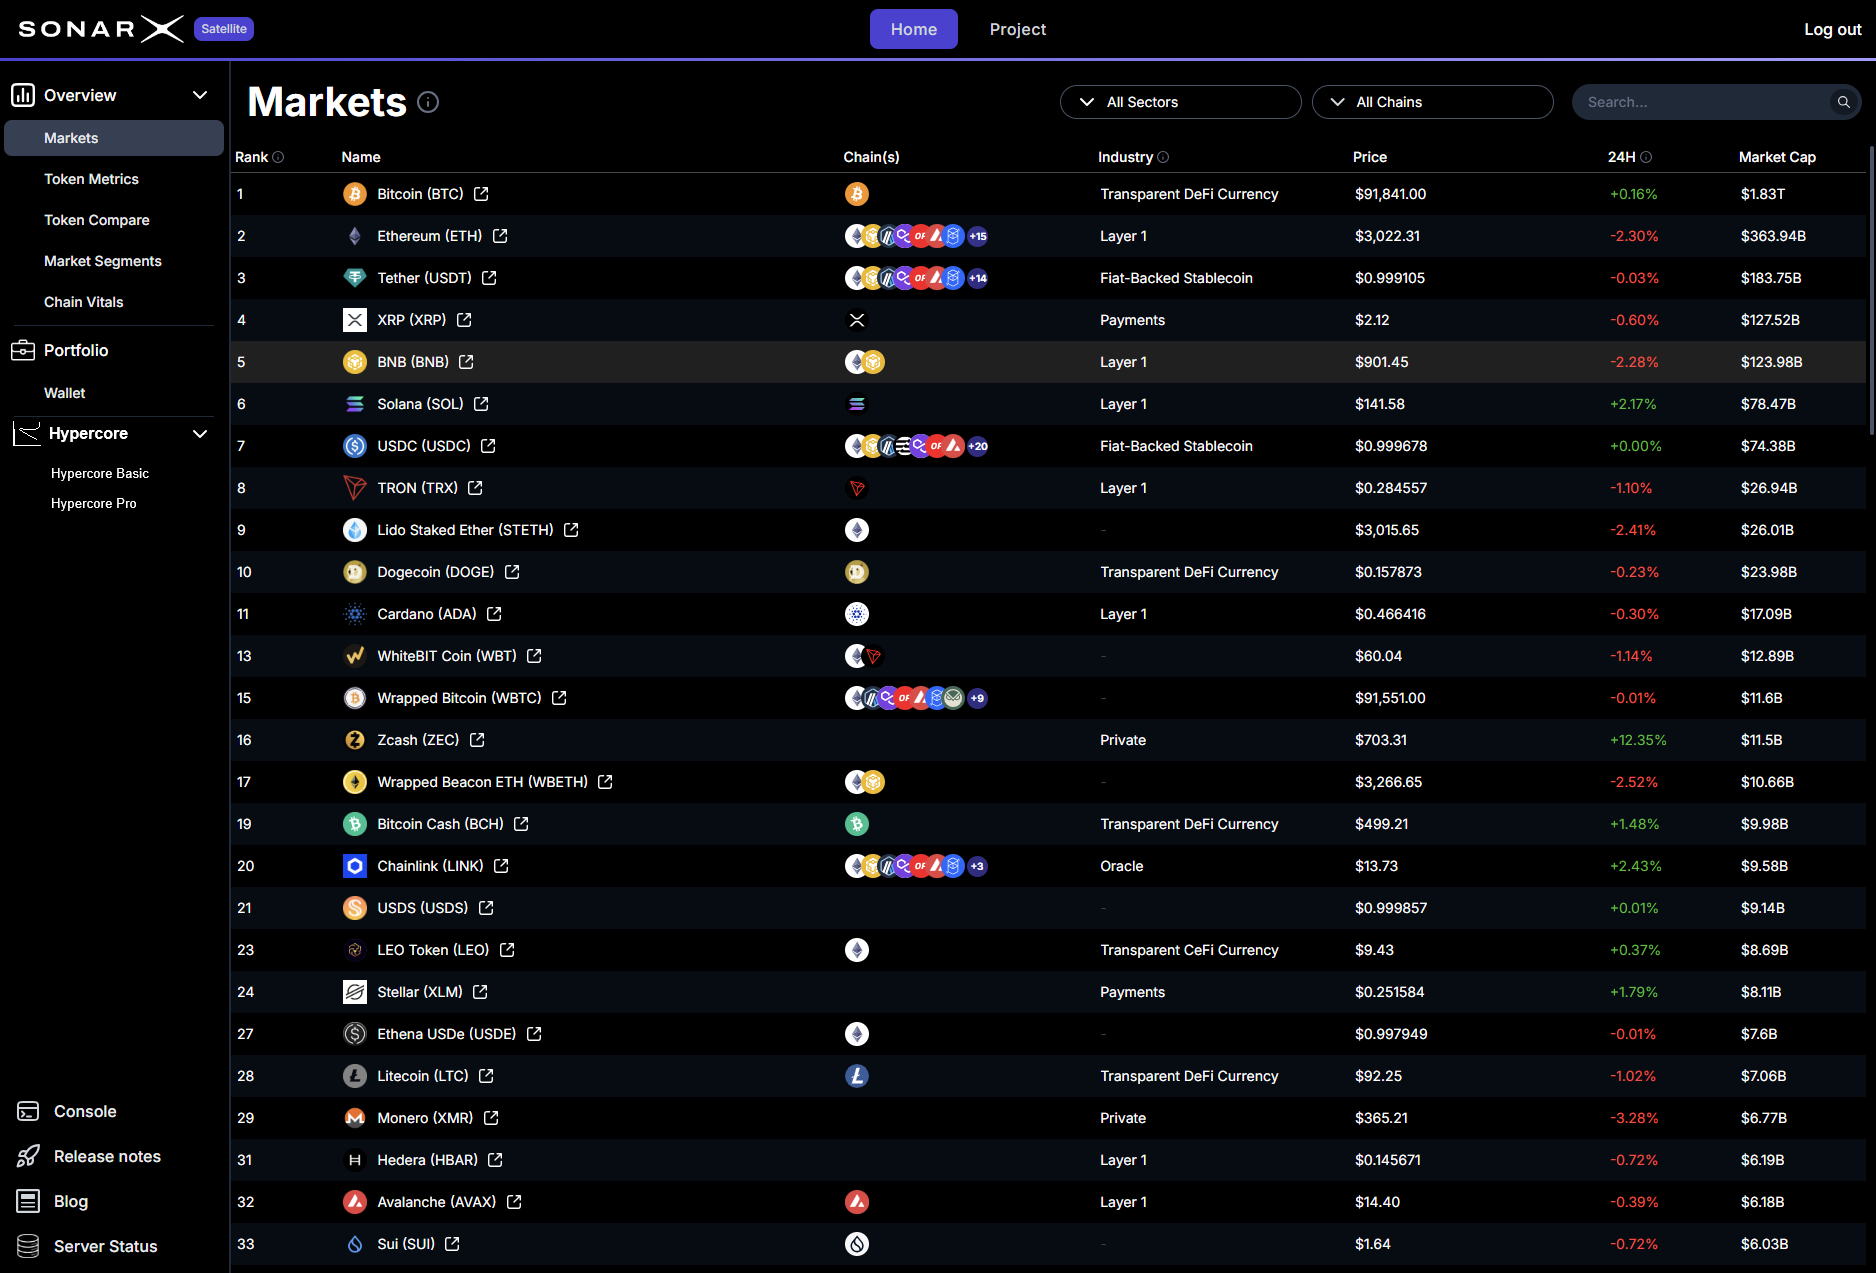
Markets
Overview of Tokens for SonarX supported chains covering the top 2,000 tokens by market capitalization according to CoinGecko
Token Metrics
Gain holistic insights into token performance and usage statistics, including volume, transfers, and user count.
Token Compare
Compare on-chain metrics such as Market Cap, Exchange Volume, and Moving Average across up to 10 chains.
Market Segments
Categorical view of metrics for each sector, segmented by industry group.
Segments are based on CoinDesk’s DACS (Digital Asset Classification Standard) 500 represents the top 500 digital assets by market capitalization.
Segments are based on CoinDesk’s DACS (Digital Asset Classification Standard) 500 represents the top 500 digital assets by market capitalization.
Chain Vitals
Track and compare key metrics by Chain (Volumes, Transactions, Transfers, Unique Users) and by Asset (Volumes, Transfers, Unique Users)
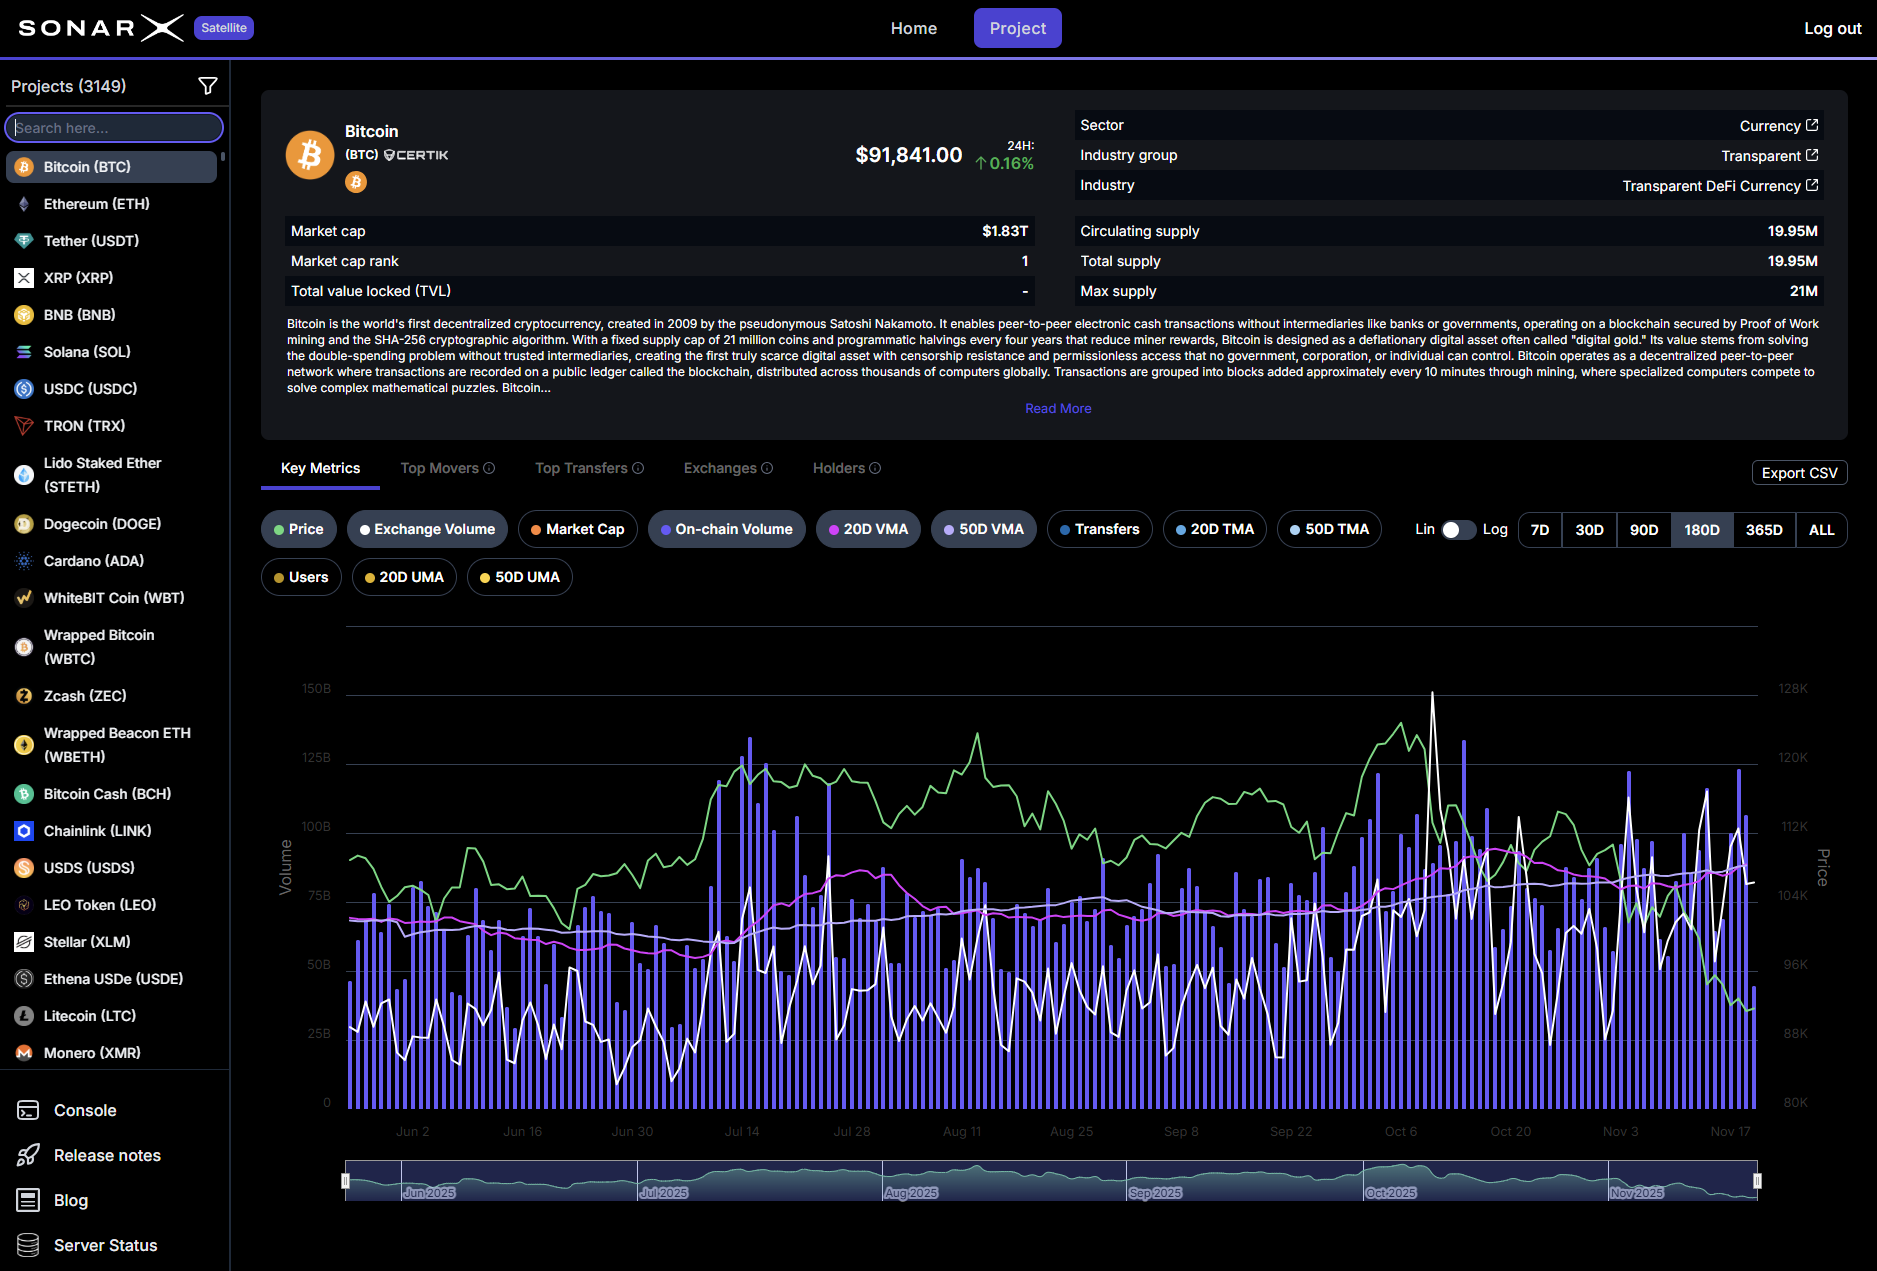
Project
In-depth view of each Token (Market Cap, TVL, Supply, Unique Users) with its Key metrics, Top Movers, Top Transfers, Exchanges, and Holders.