The Market Segments page provides a categorical view of the digital asset landscape.
Satellite Market Segments page

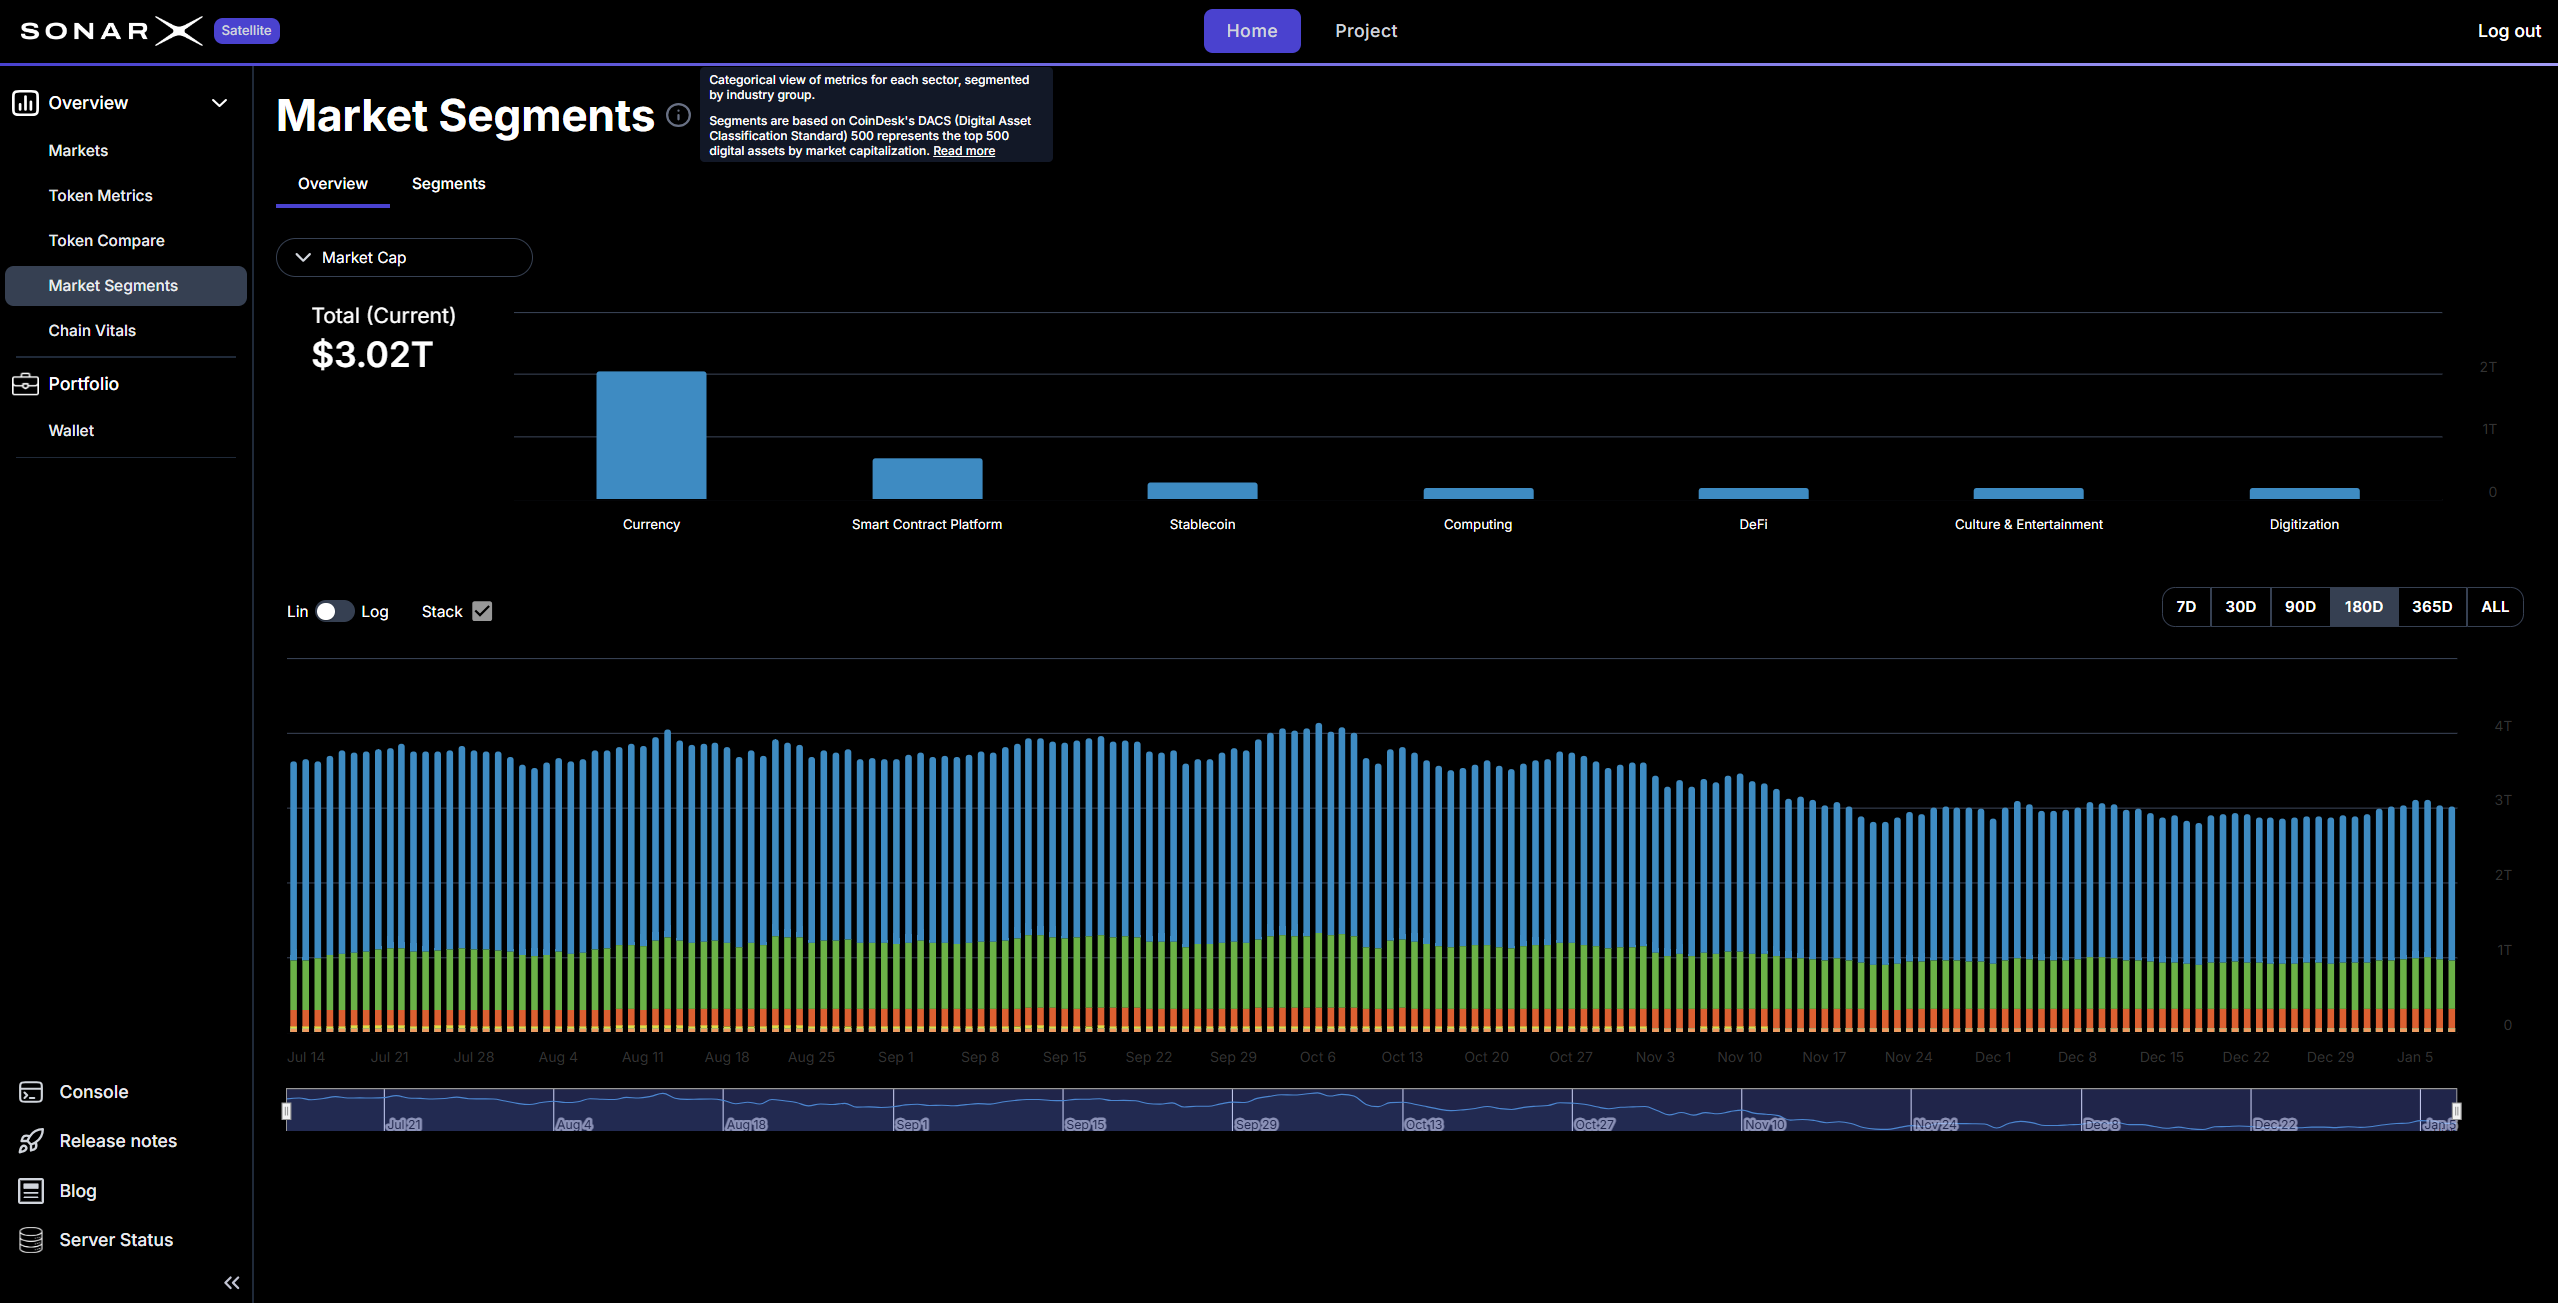
Satellite: Market Segments

It uses the CoinDesk DACS methodology to group tokens into specific industries.1 This section focuses on the DACS 500, which represents the 500 largest assets by market value. It organizes them into six main sectors: Currency, Smart Contract Platforms, DeFi, Culture & Entertainment, Computing, and Digitization. The data is presented in clear bar charts and historical trend lines. You can toggle between linear and logarithmic views to see the data in different ways. This helps you identify long-term patterns that might be hidden in daily price movements. It is an excellent resource for sector rotation strategies.
For each segment, Satellite shows multiple metrics, such as Market Cap, Exchange Volume, On-chain Volume, transfers, and Users. All monetary values are in $USD. This gives you a bird’s-eye view of where the most capital /activity/users are flowing. You can see which sectors are dominant and which are still in the early stages of growth. It is a simple way to monitor the health of different parts of the crypto economy.
Understanding these segments is helpful because different industries often react differently to market events. DeFi tokens might rise while the rest of the market is flat. Computing assets might follow a different path. Satellite allows you to see these shifts as they happen. It provides the structured data you need to make informed decisions about where to focus your attention.

Focus on a single asset (token)

At any point in time, users can click on one of the displayed assets to launch the “**Project**” view, where they can access in-depth information for the selected asset. See more details in the dedicated section for the Project page.