Project serves as the premier interface for analyzing assets in the SonarX data ecosystem.
Satellite Project page

Satellite: Project

It provides a deep, multi-dimensional view of a project’s financial standing and operational health. By centralizing core metrics, it eliminates the need for fragmented research across multiple explorers. The interface is divided into three primary modules: Key Info & Supply Data, Key Metrics & Market Stats, and On-Chain Activity. This structure ensures that users can verify the economic reality of an asset using high-fidelity data sourced from the SonarX historical dataset and CoinGecko.
Satellite Project page

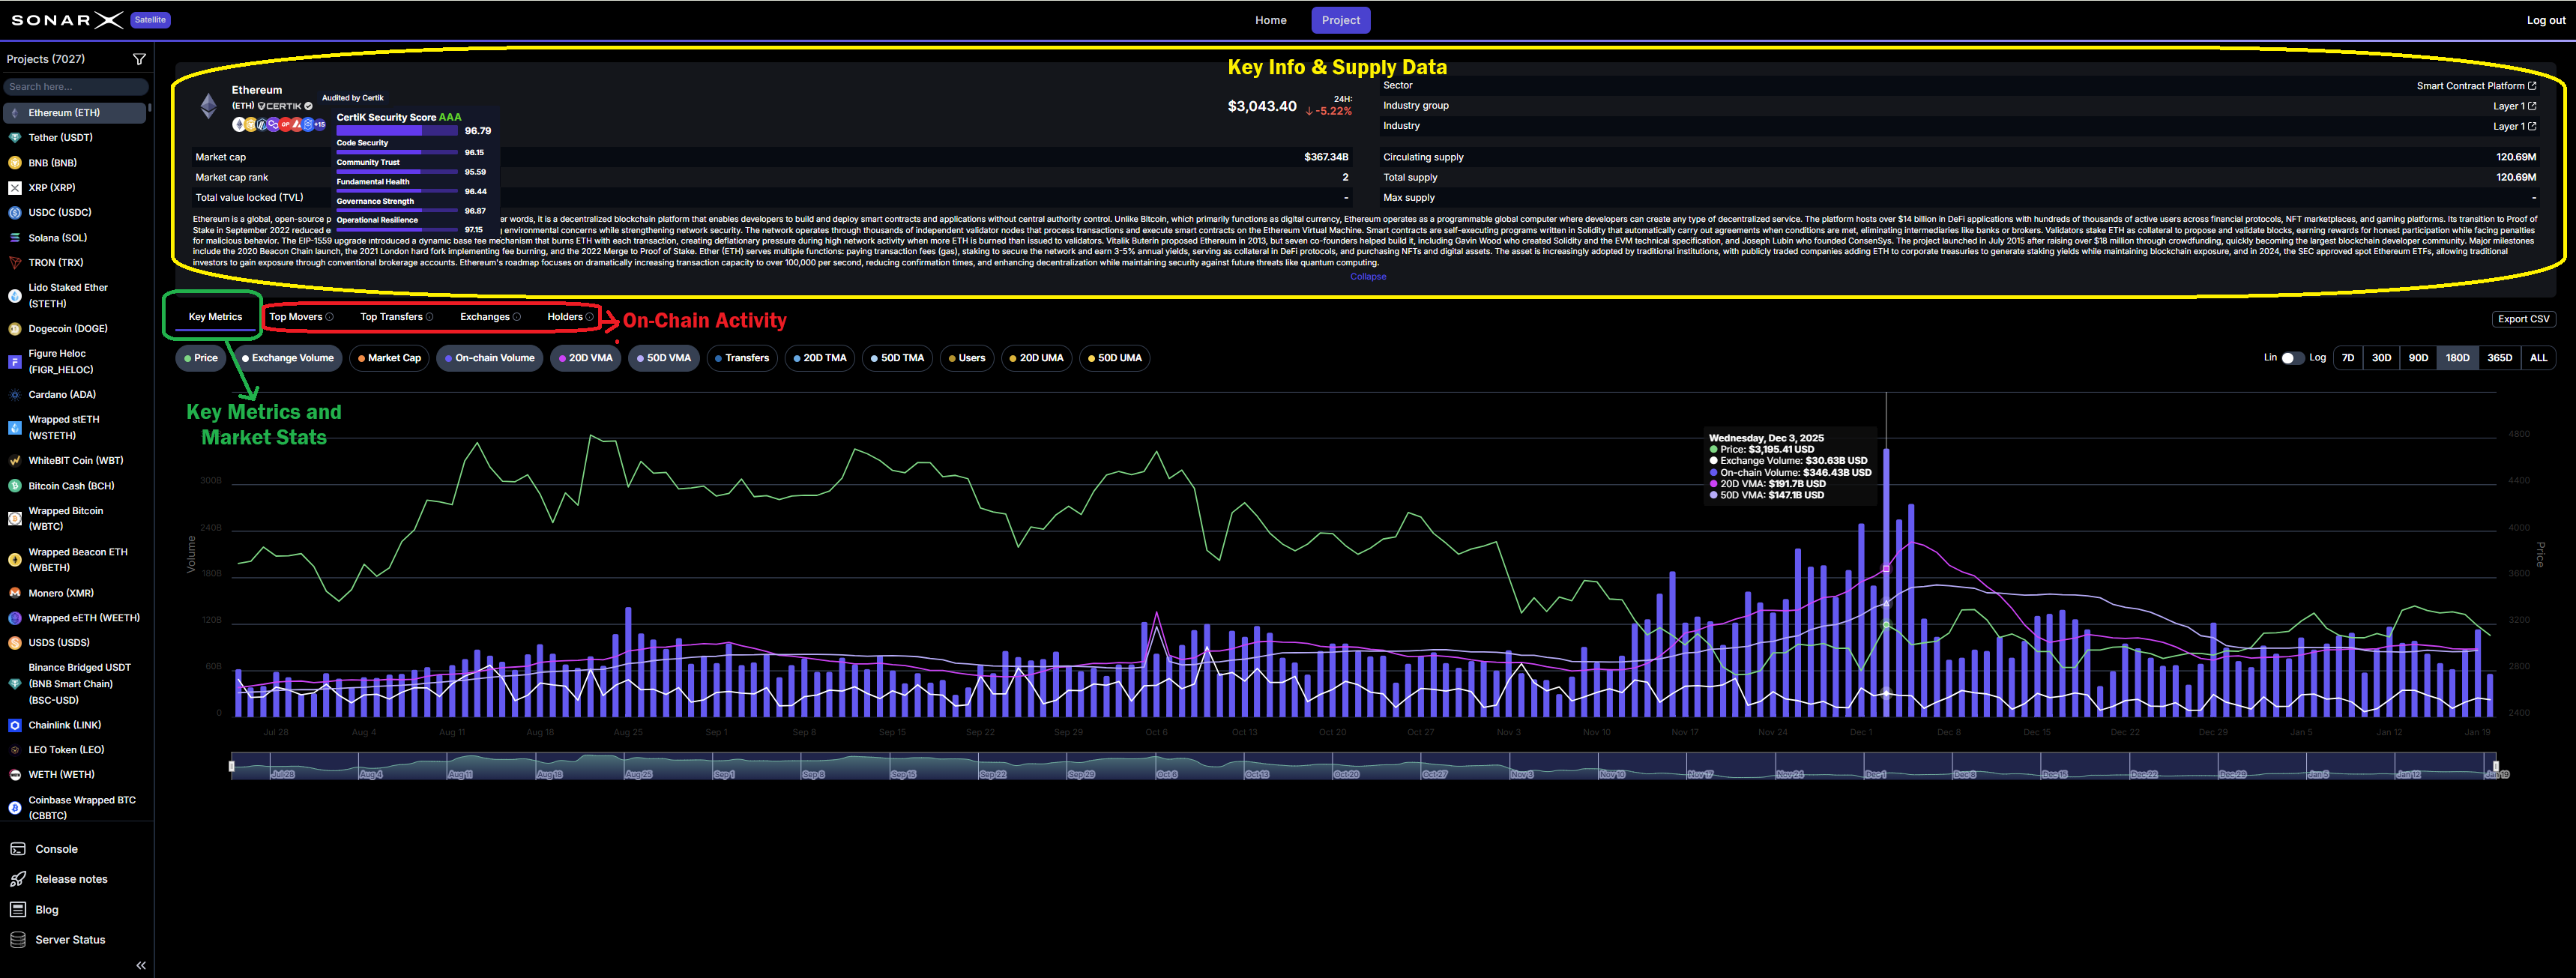
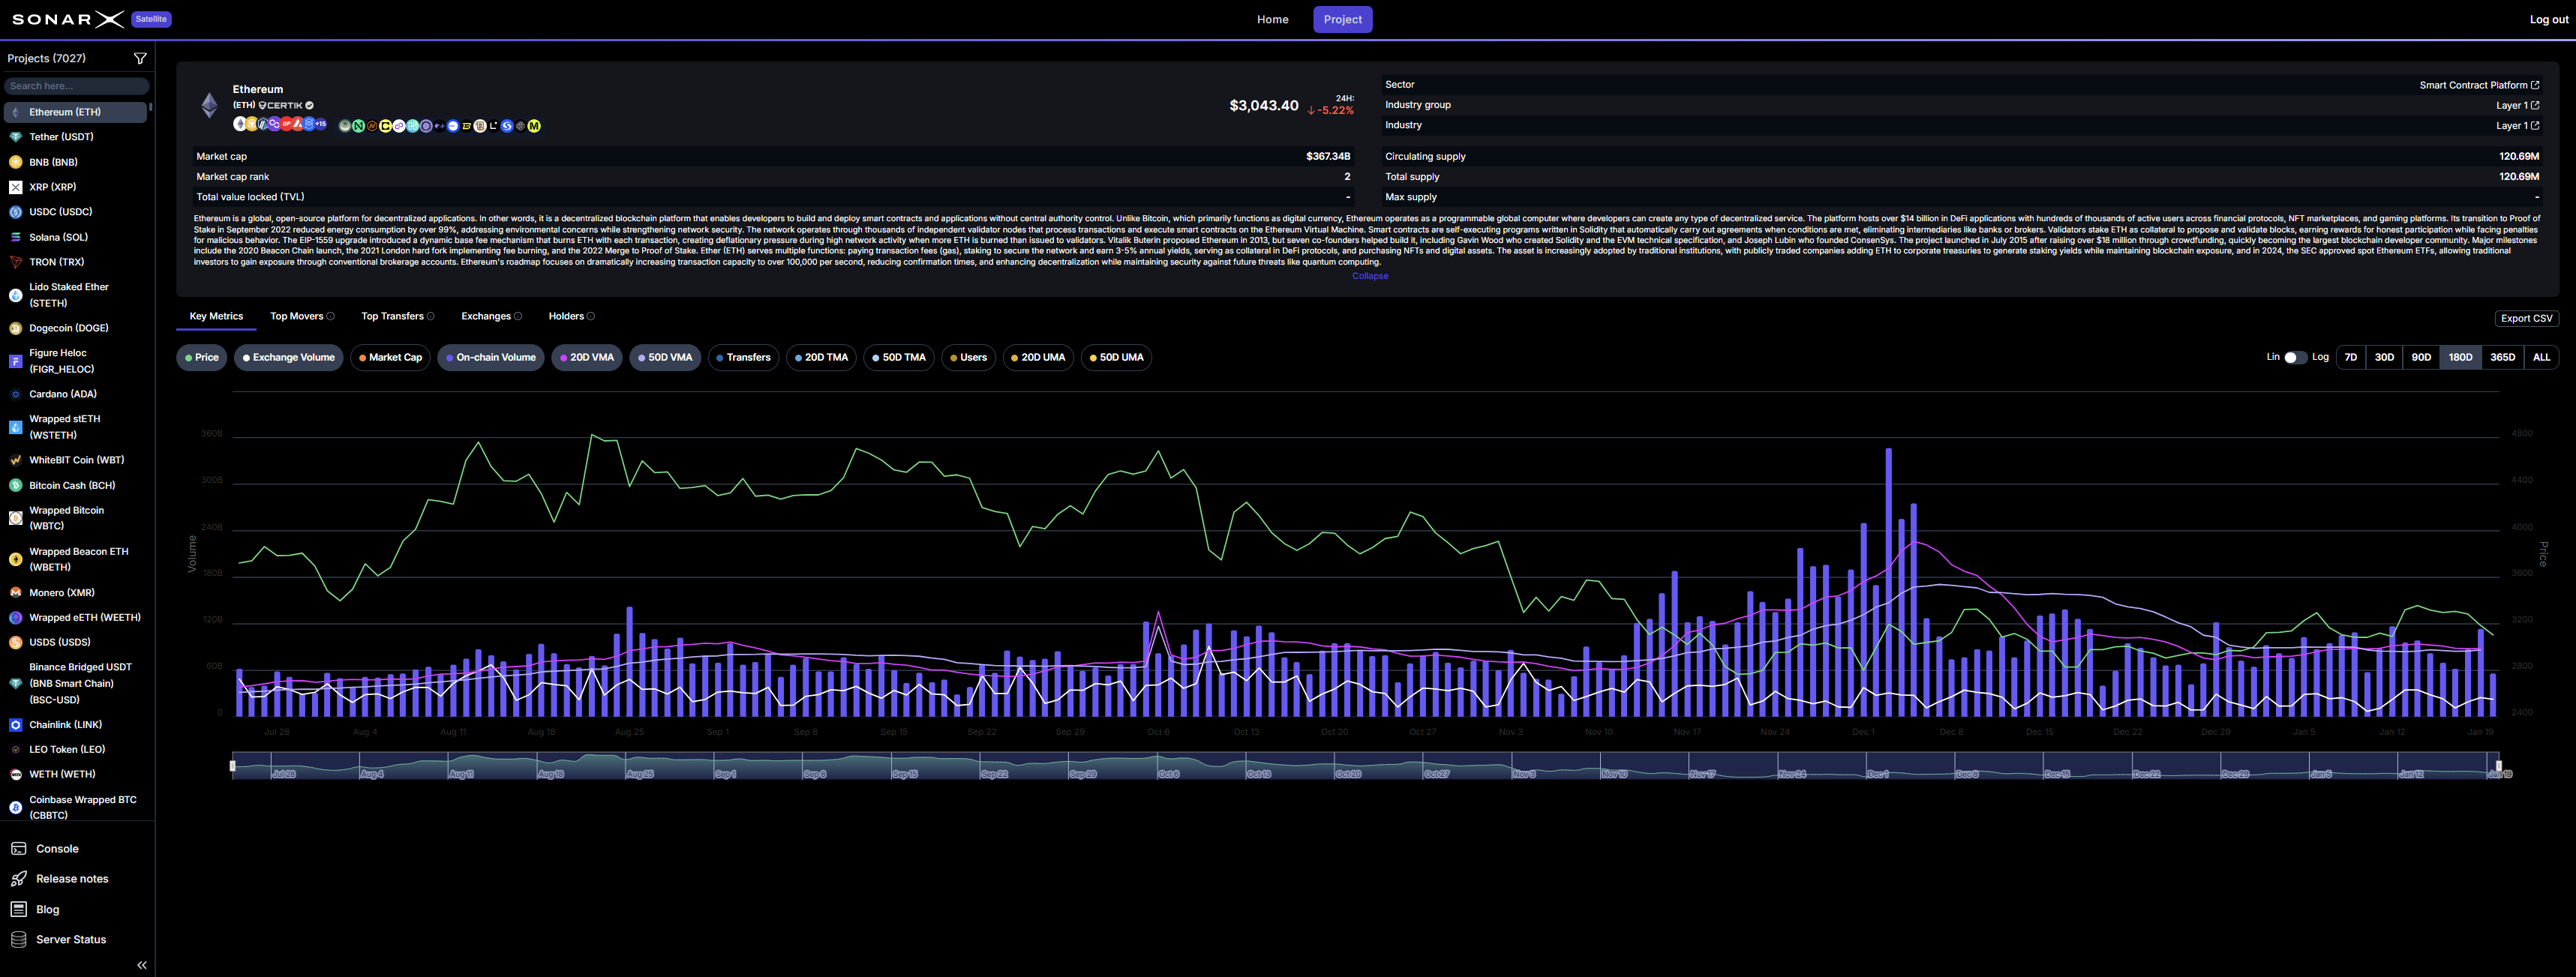
Satellite: Key Info & Supply Data, Key Metrics & Market Stats, and On-Chain Activity

The Supply module provides immediate clarity on a token’s economic structure. It displays Total Supply, Circulating Supply, and Max Supply. These figures allow users to assess the current market saturation and the potential for future dilution. This transparency is fundamental for understanding the long-term value proposition of an asset. It removes the guesswork often associated with complex tokenomics by presenting the data in a standardized format available to all users. The Market Stats module offers a comprehensive look at price performance and valuation. Beyond the current price and 24-hour shifts, this section allows investigating different historical periods. The available reference windows range from 7 days to the entire history of the asset. Users can toggle between linear and logarithmic scales to better visualize trends. This scaling preference applies to every numerical chart on the page, ensuring a consistent analytical perspective. By comparing the Fully Diluted Valuation (FDV) to the current Market Cap, users gain a complete picture of the project’s financial footprint. To filter out short-term volatility, the platform includes both 20-day and 50-day moving averages for these metrics. These are calculated specifically using the UTC Close price for global consistency. These trend lines remain visible on the chart across all selected timeframes, providing a constant reference point for historical performance. The On-Chain Activity module is the core of the Project page. It provides a breakdown of performance across every SonarX-supported chain where the asset is active. This table tracks Movers, Transfers, Exchanges and Holders (currently available for Ethereum only. It can be extended to other chains upon request).
Satellite Project page

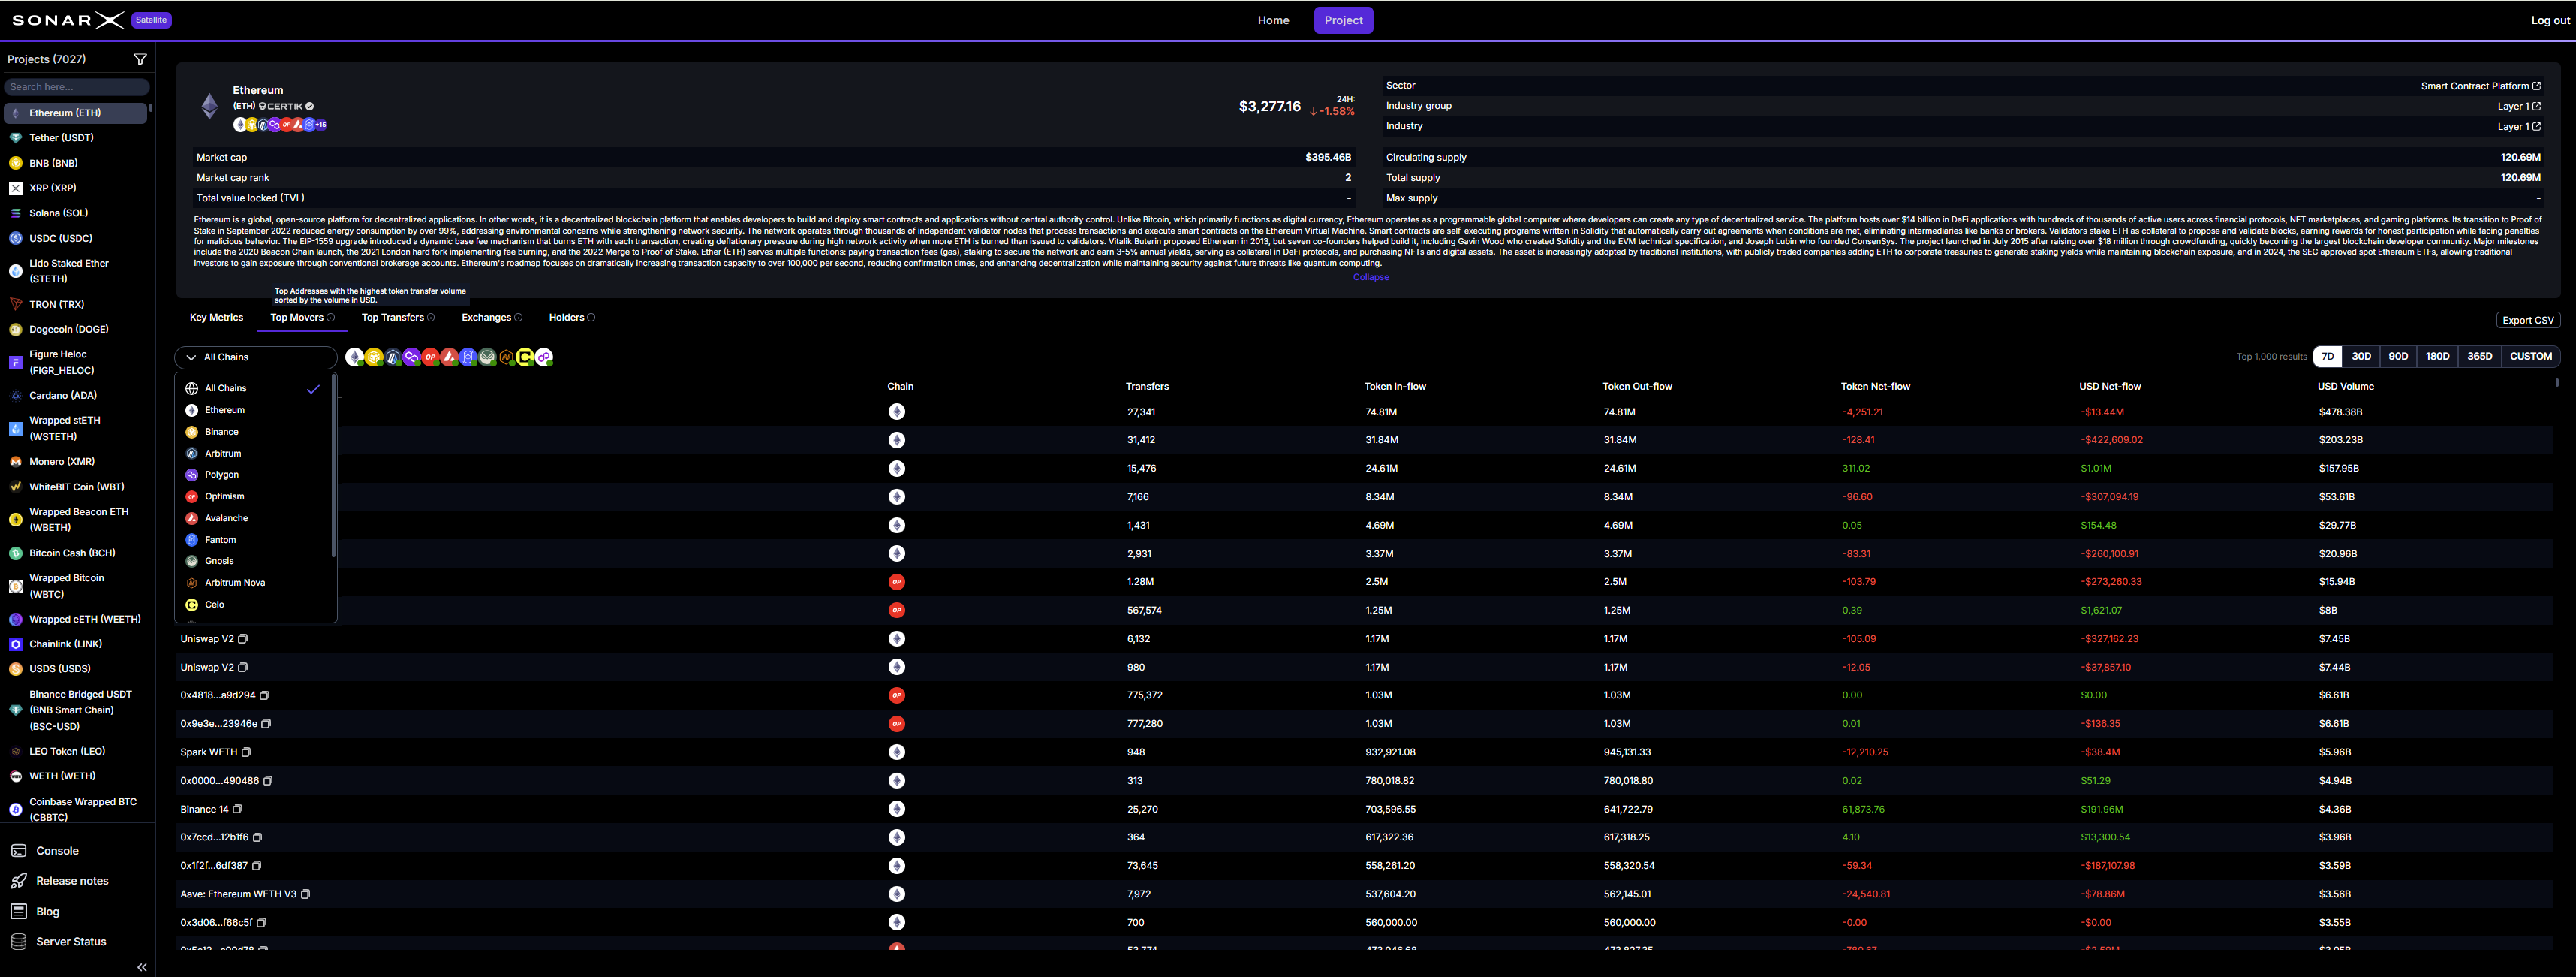
Satellite: Top Movers

Satellite Project page

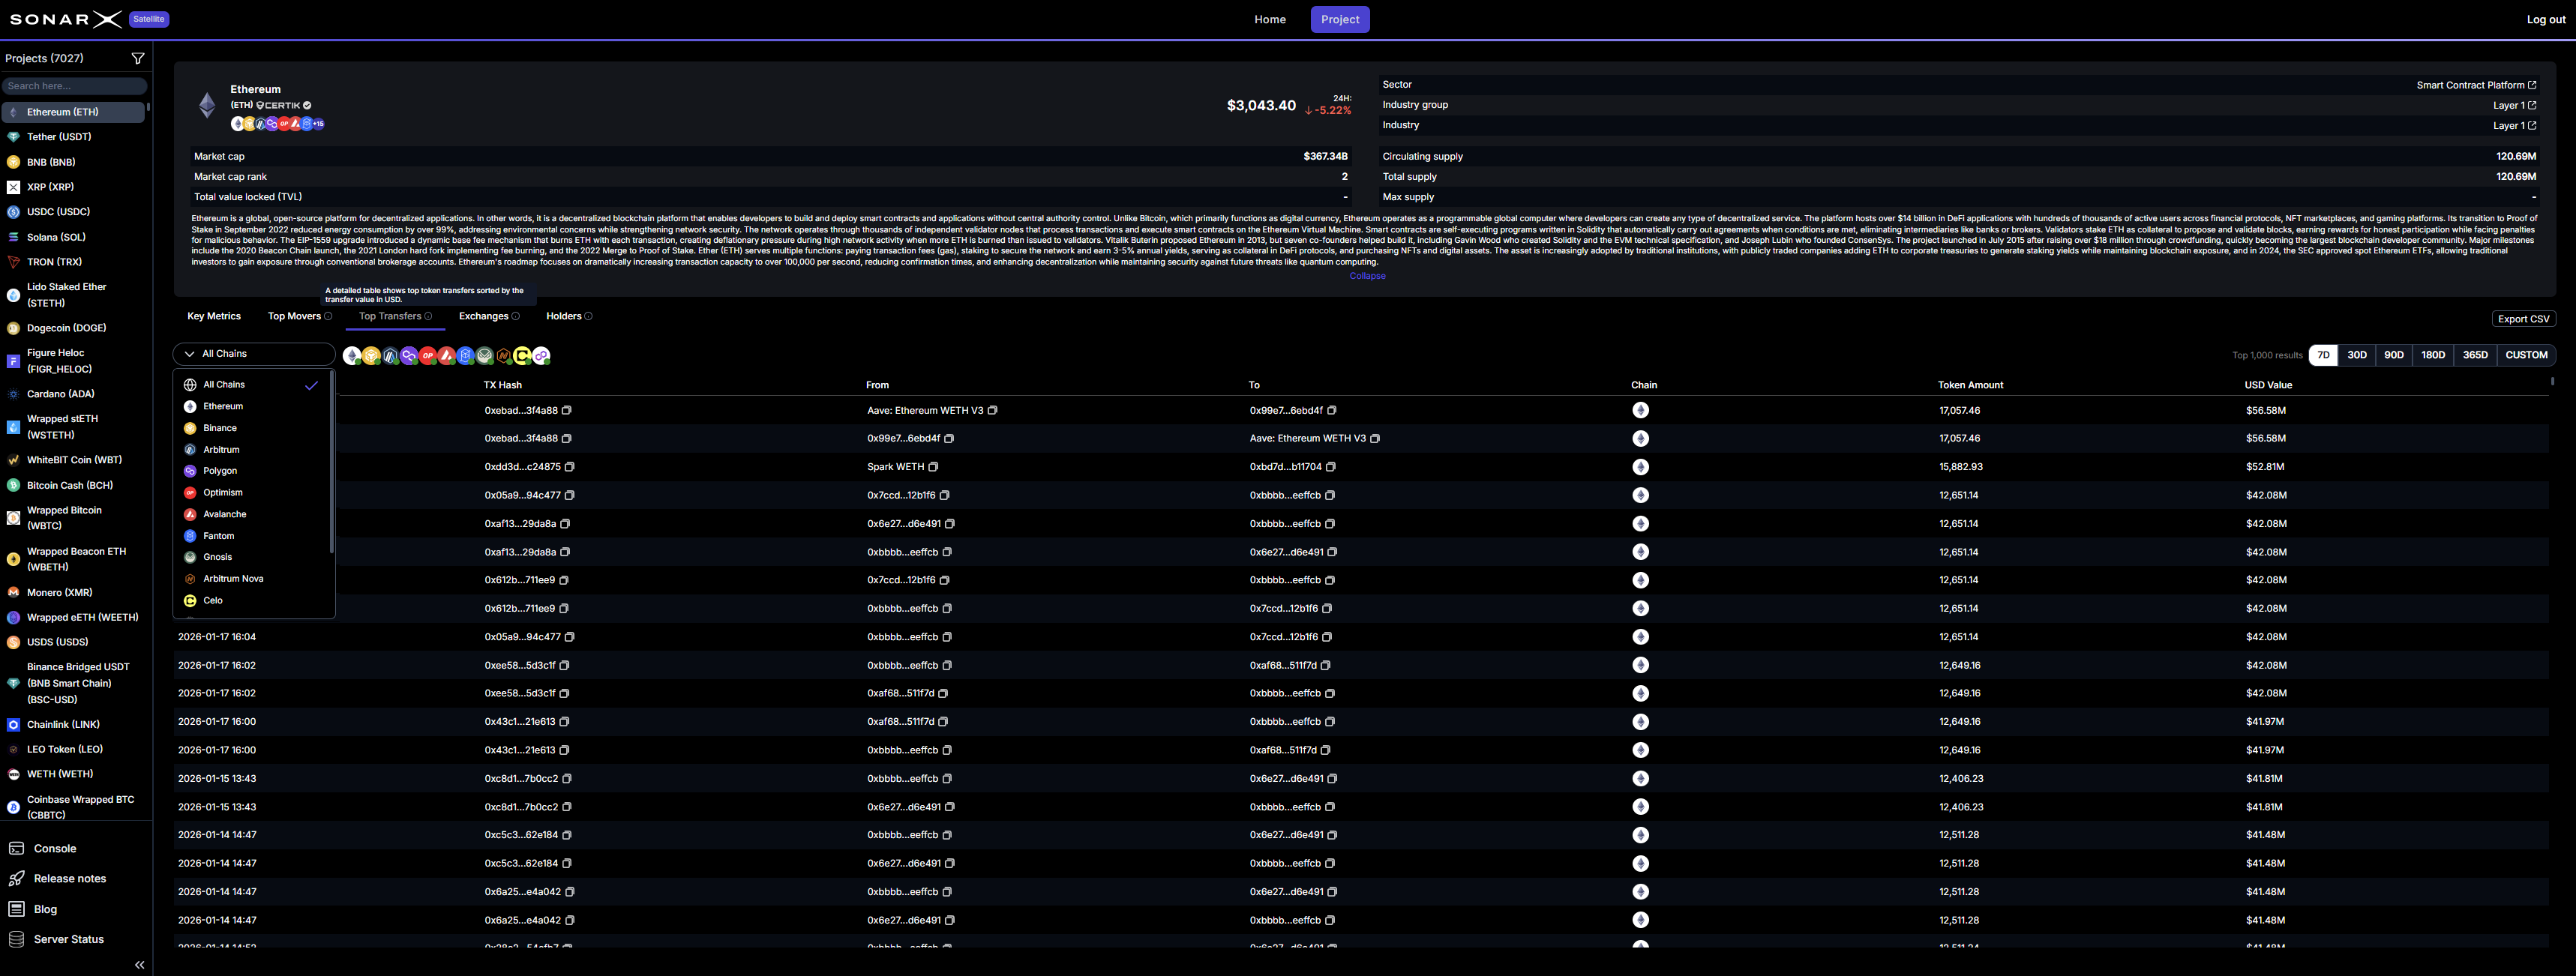
Satellite: Top Transfers

Satellite Project page

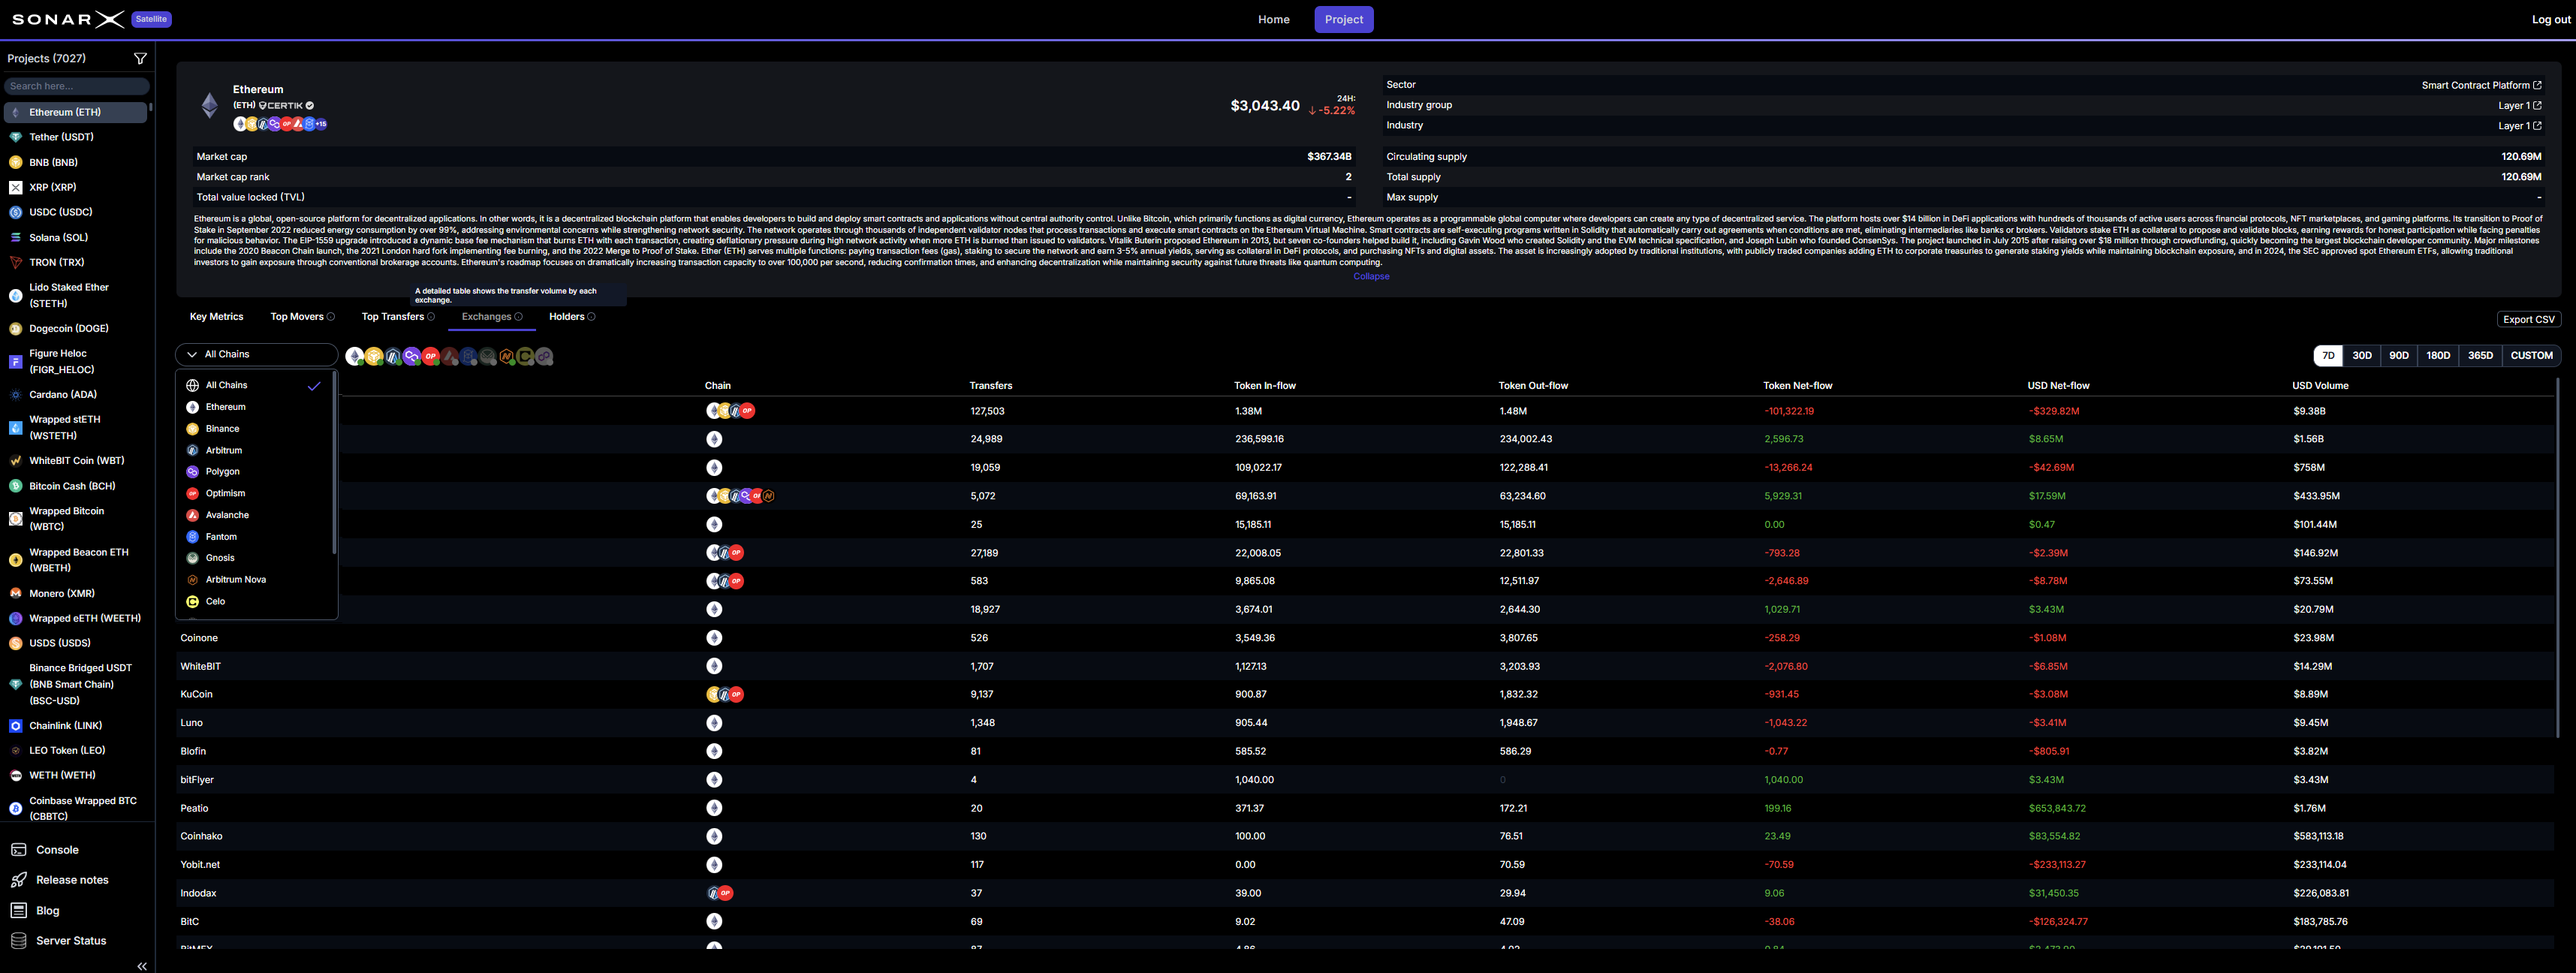
Satellite: Exchanges
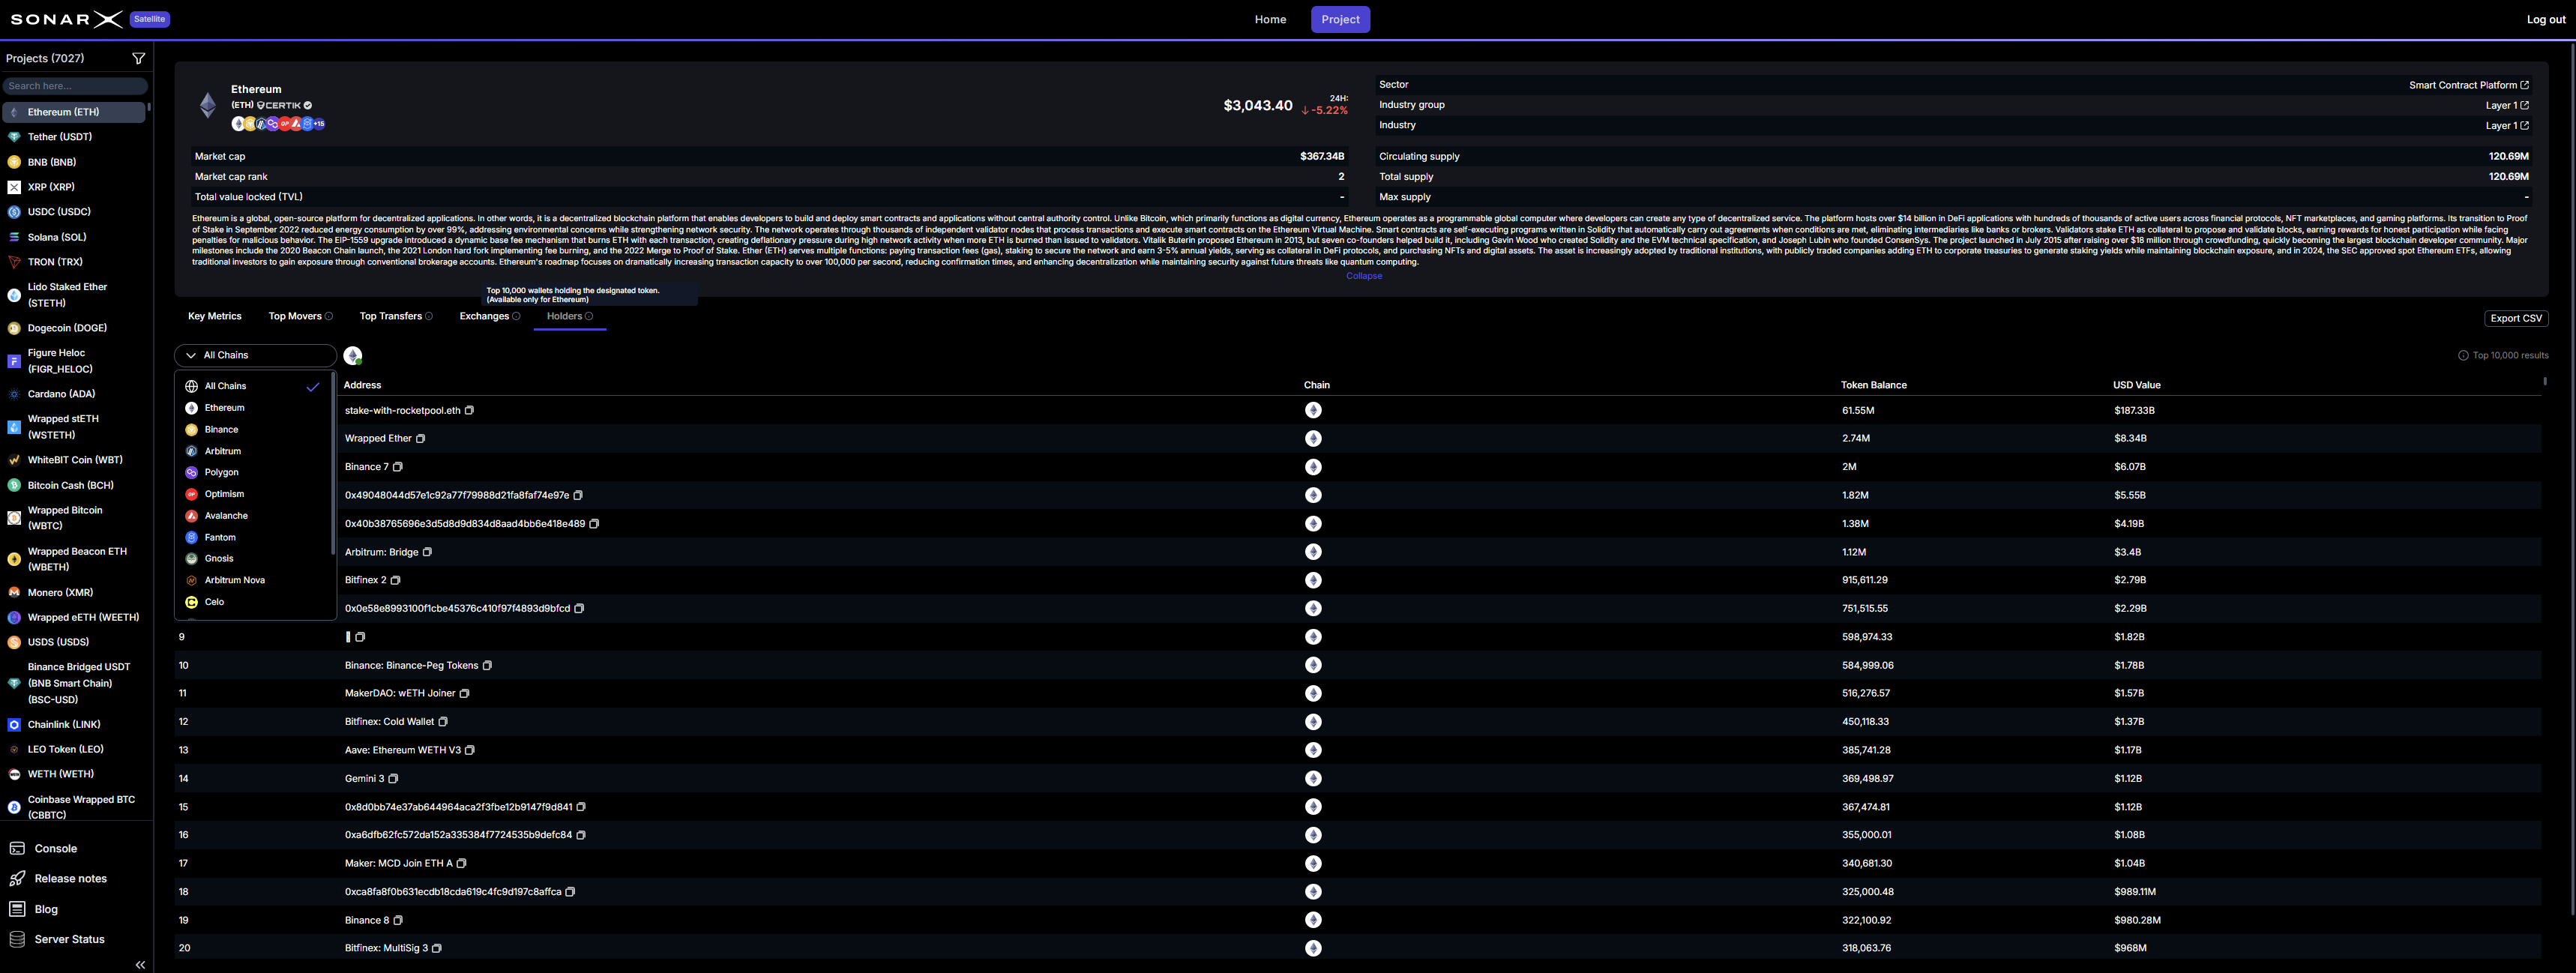
Satellite Project page

Satellite: Holders

The Project section is built for those who require precision in their research. For advanced auditing and offline analysis, users can export data in CSV format. The export functionality captures the exact dataset visualized on the screen at the moment of the request, including all active moving averages and chain-specific rows. By combining broad market data with granular, chain-specific activity, the Project page transforms raw transaction logs into actionable intelligence. It ensures that every analysis is grounded in the most accurate information available in the blockchain ecosystem.