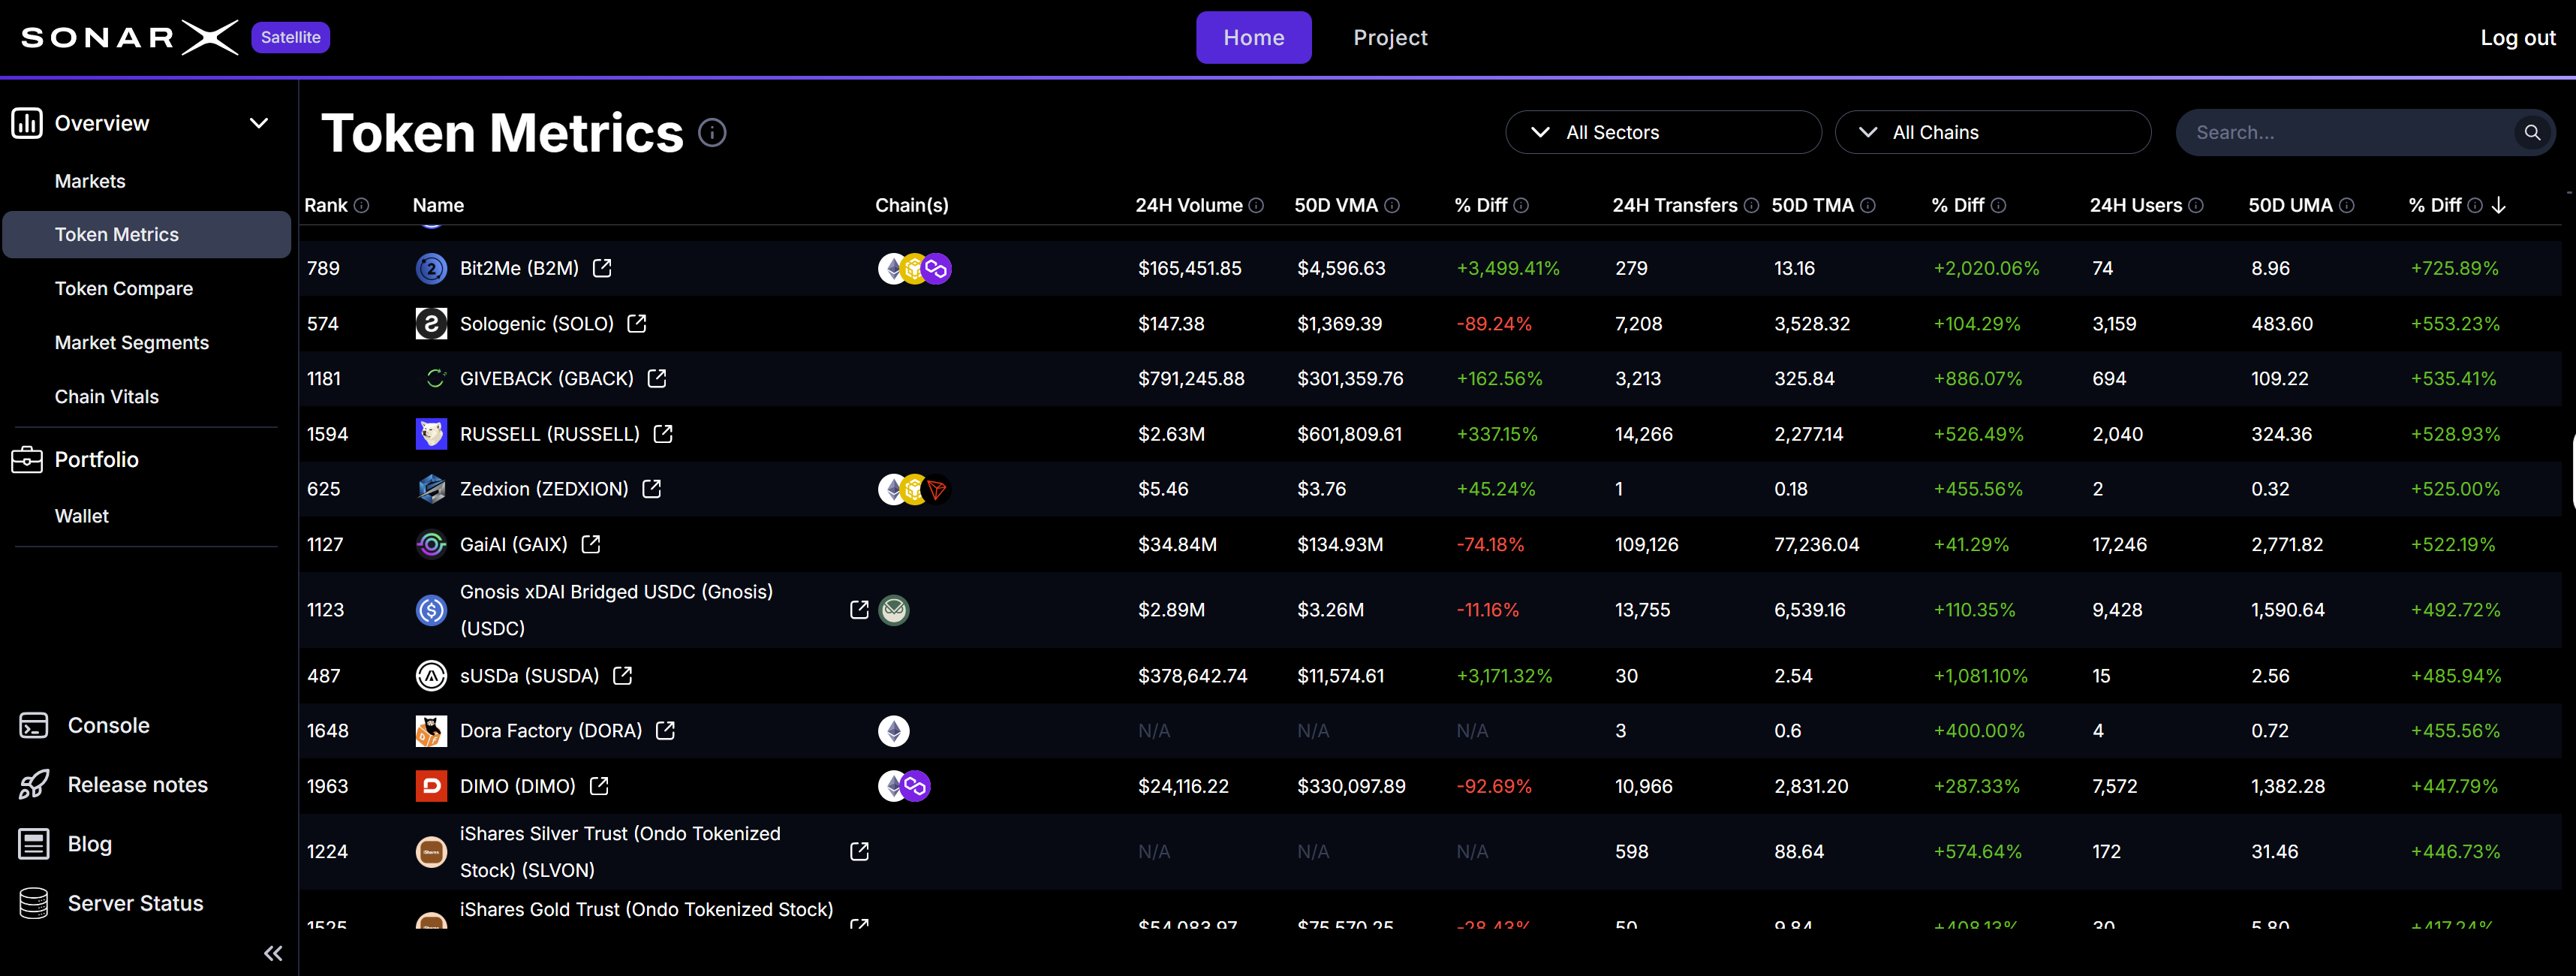
Satellite: Token Metrics
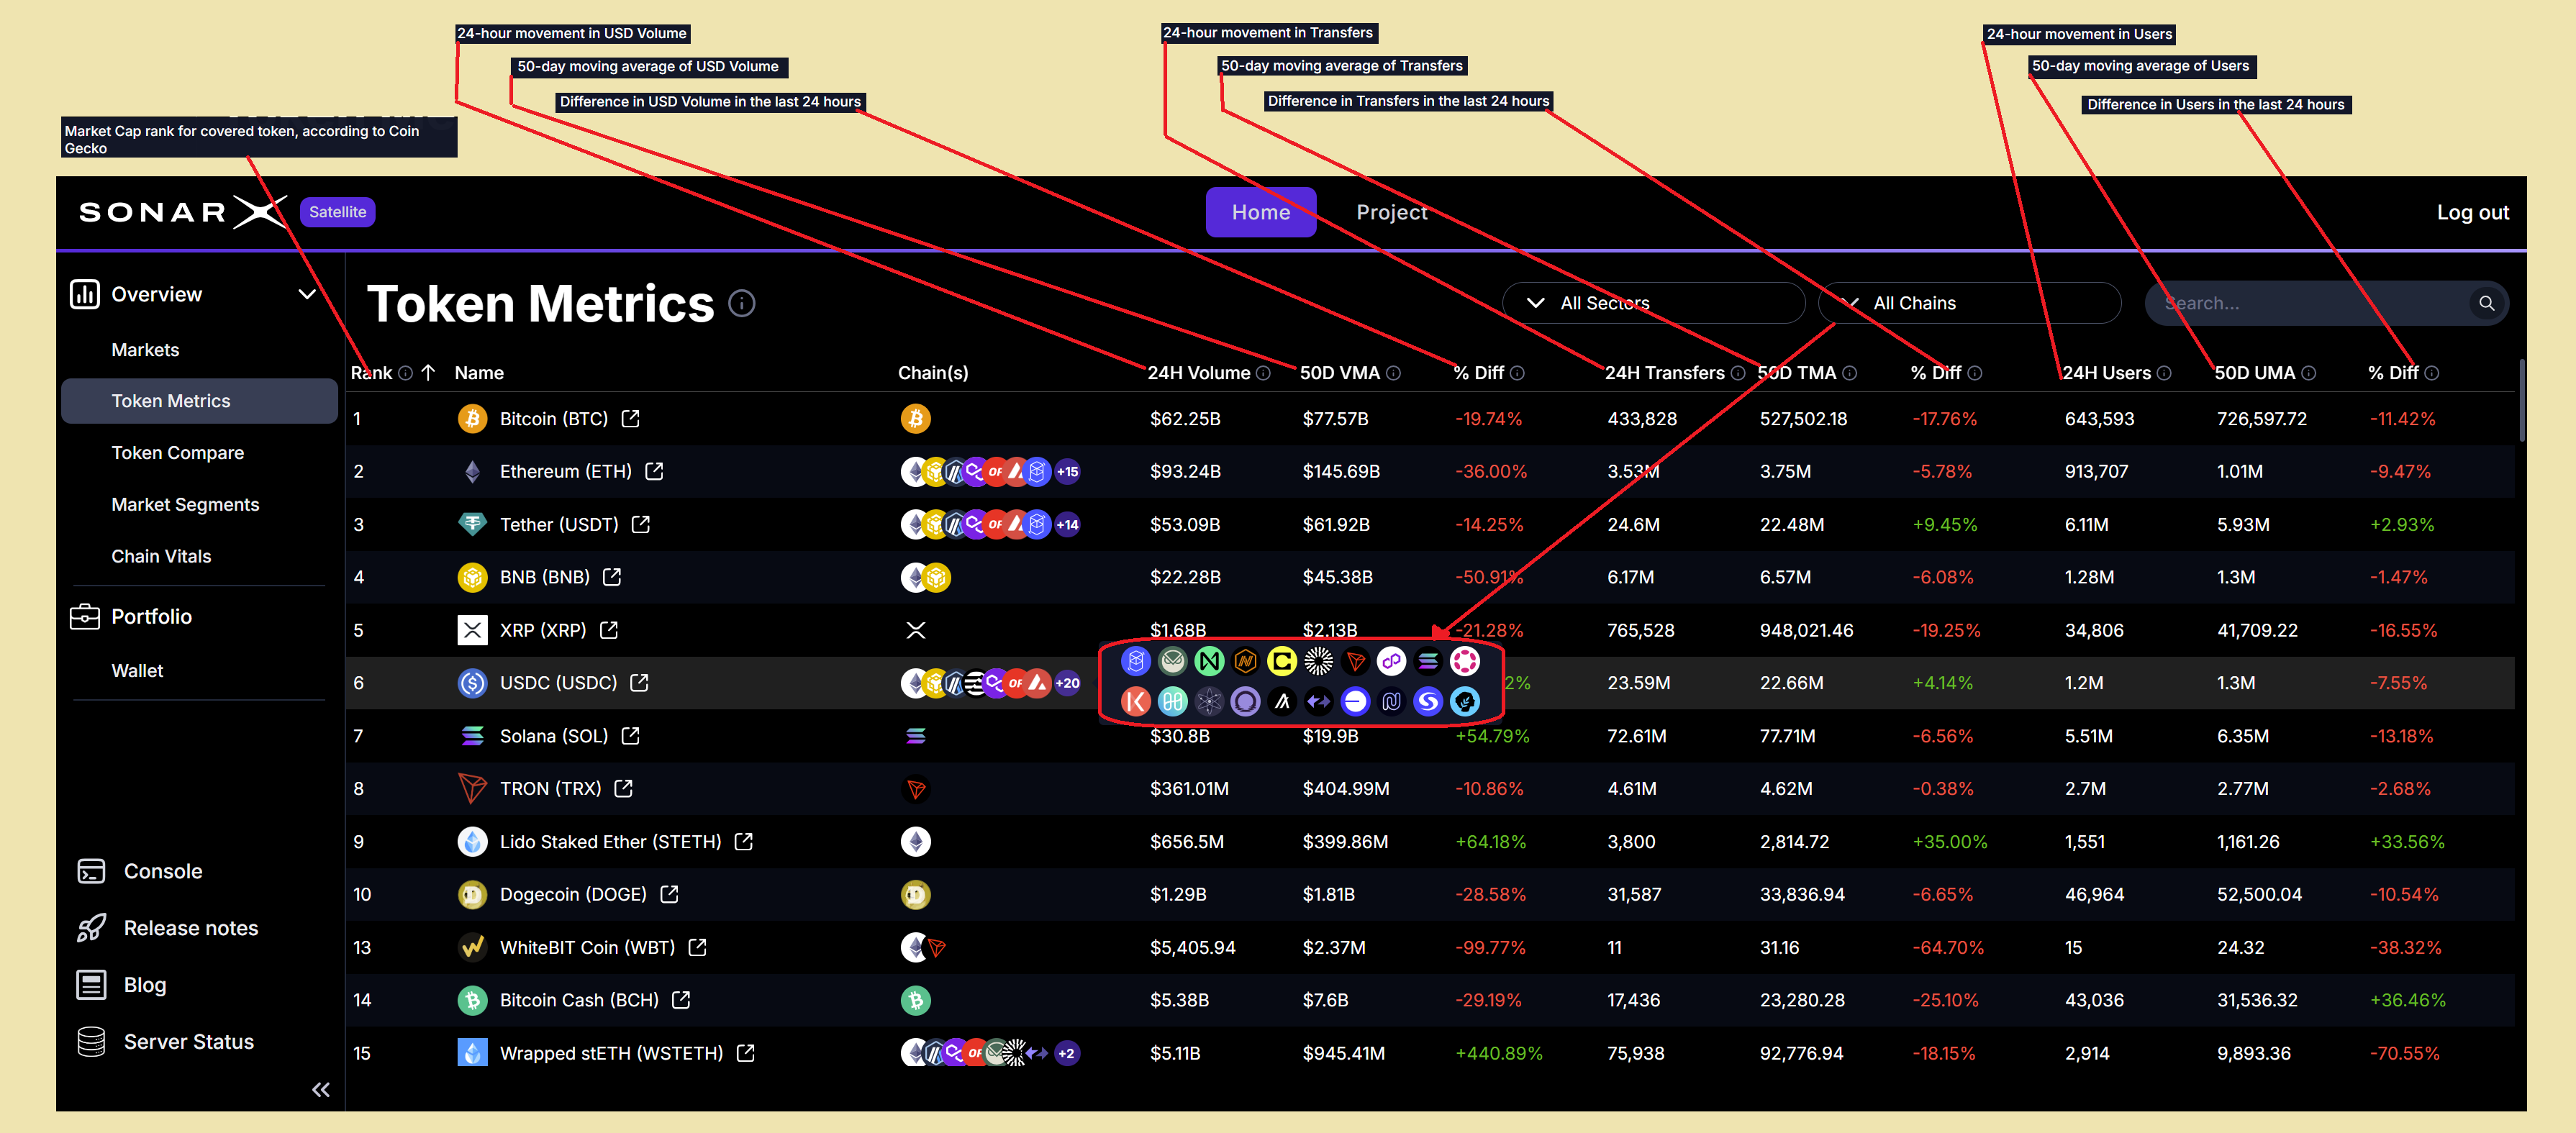
Satellite: Token Metrics - Volumes, Transfers, & Users: current, 50D MA, and % Diff.
Easy filtering for finding, comparing, slicing&dicing, and focusing
By default, the Satellite Token Metrics page displays all tokens across all supported chains. Users can easily and quickly perform focused searches and analyses by using the available filters: Chains and DACS classification.Filter by Chain
To filter for assets supported on an individual chain, or conversely across all chains, users can simply click on the chain drop-down and select what chain they want to filter by (for example: Arbitrum):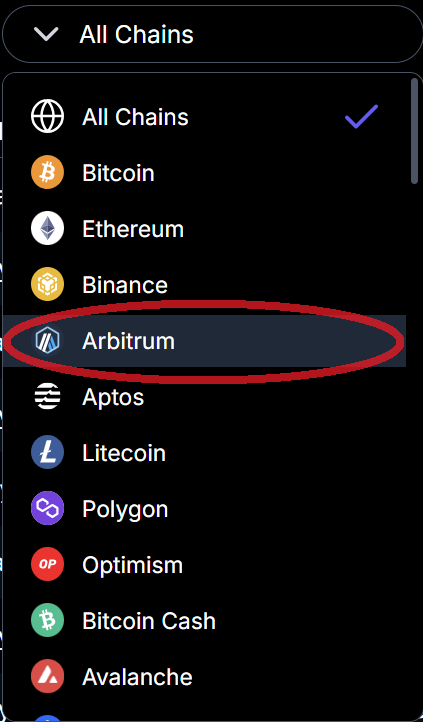
Satellite: Token Metrics - filter by Chain (example: Arbitrum)
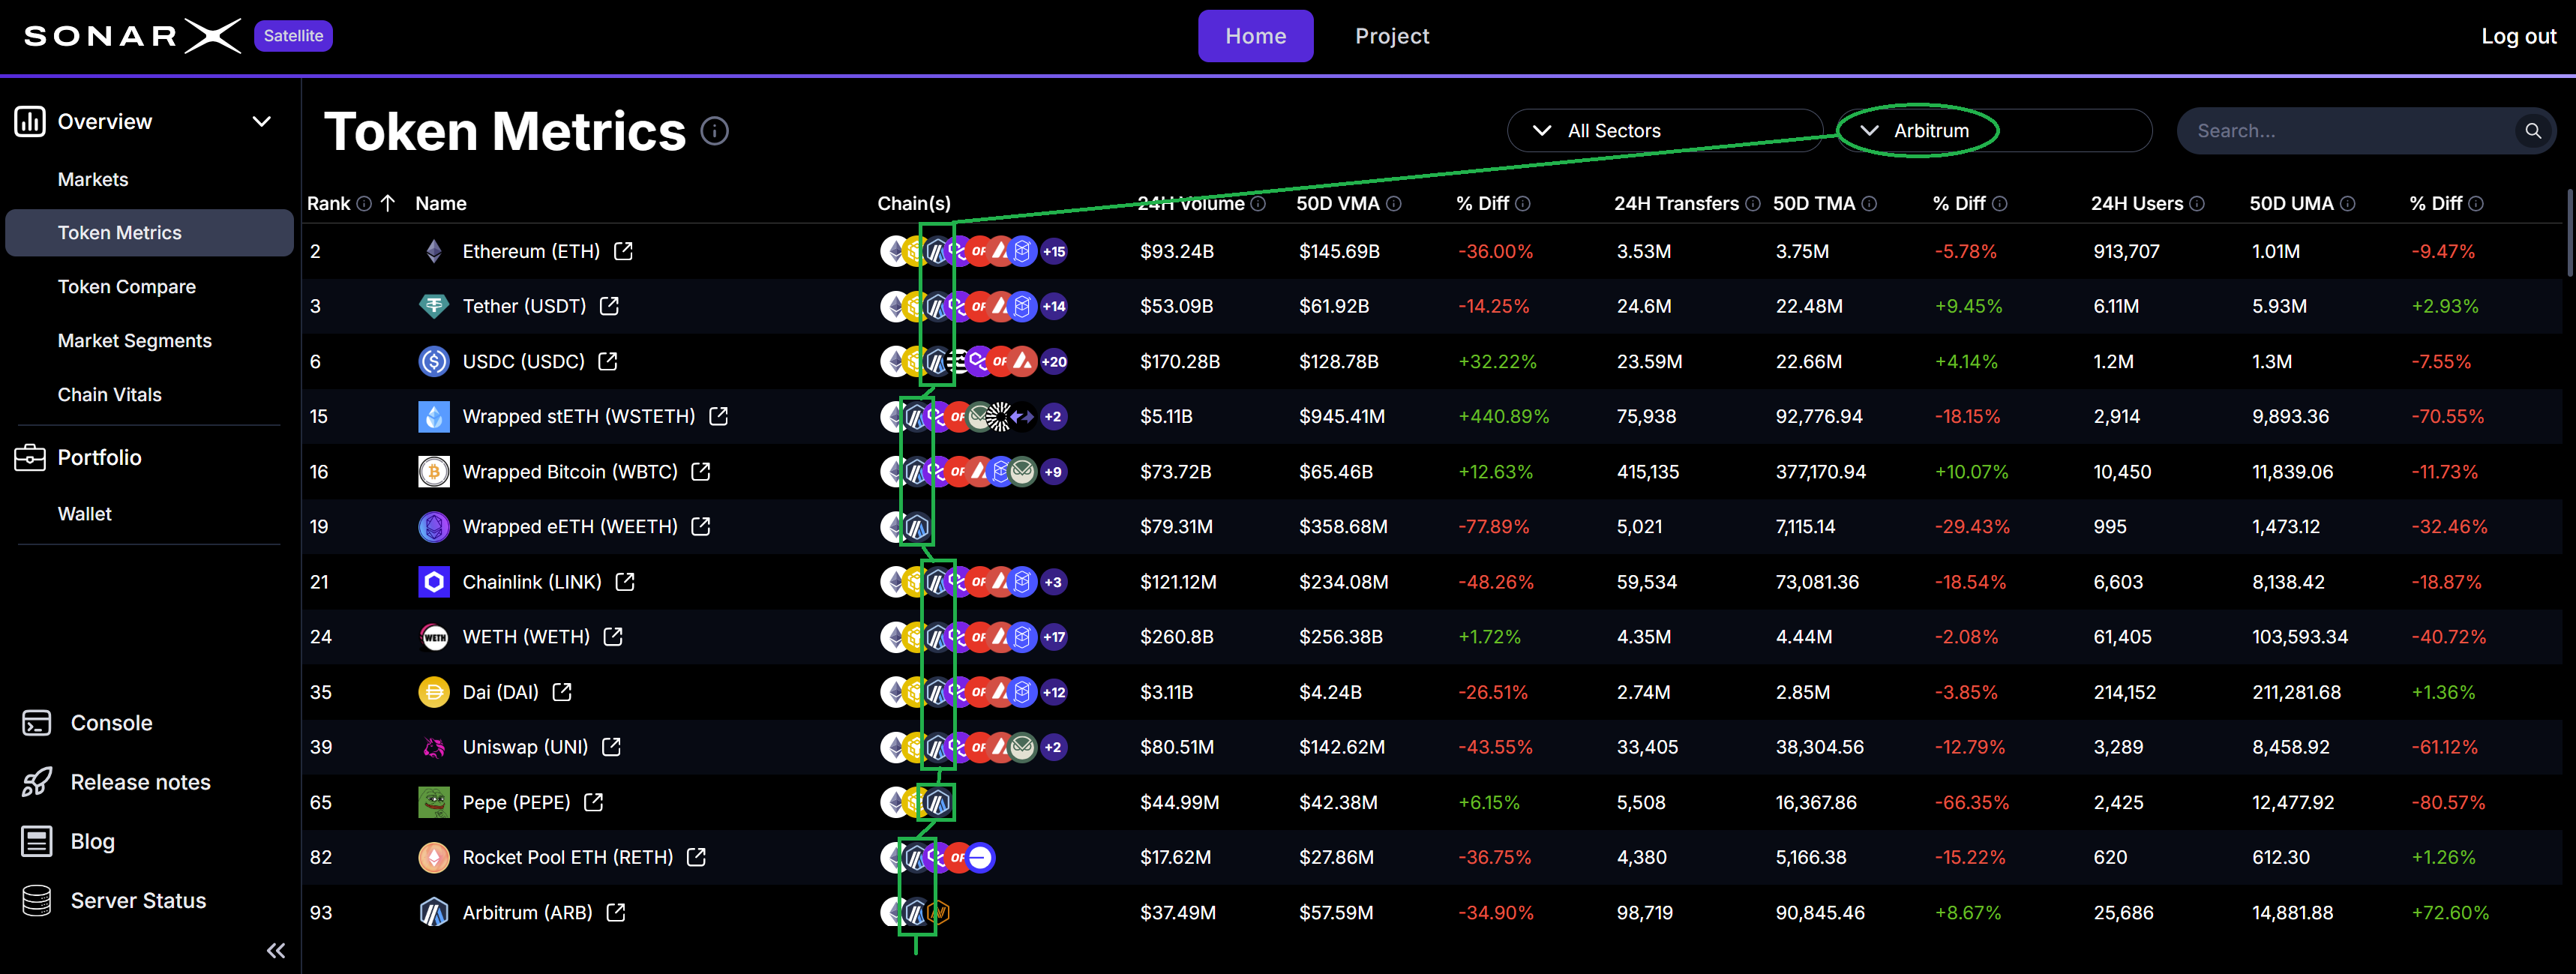
Satellite: Token Metrics - Assets supported on selected chain (example: Arbitrum)
Filter by DACS Sector / Industry Group / Industry
To filter for assets that DACS classifies in a specific Sector, Industry Group, or Industry, users can click the classification drop-down, select the level at which to apply the filter, and choose the particular value (at that level) they want to use: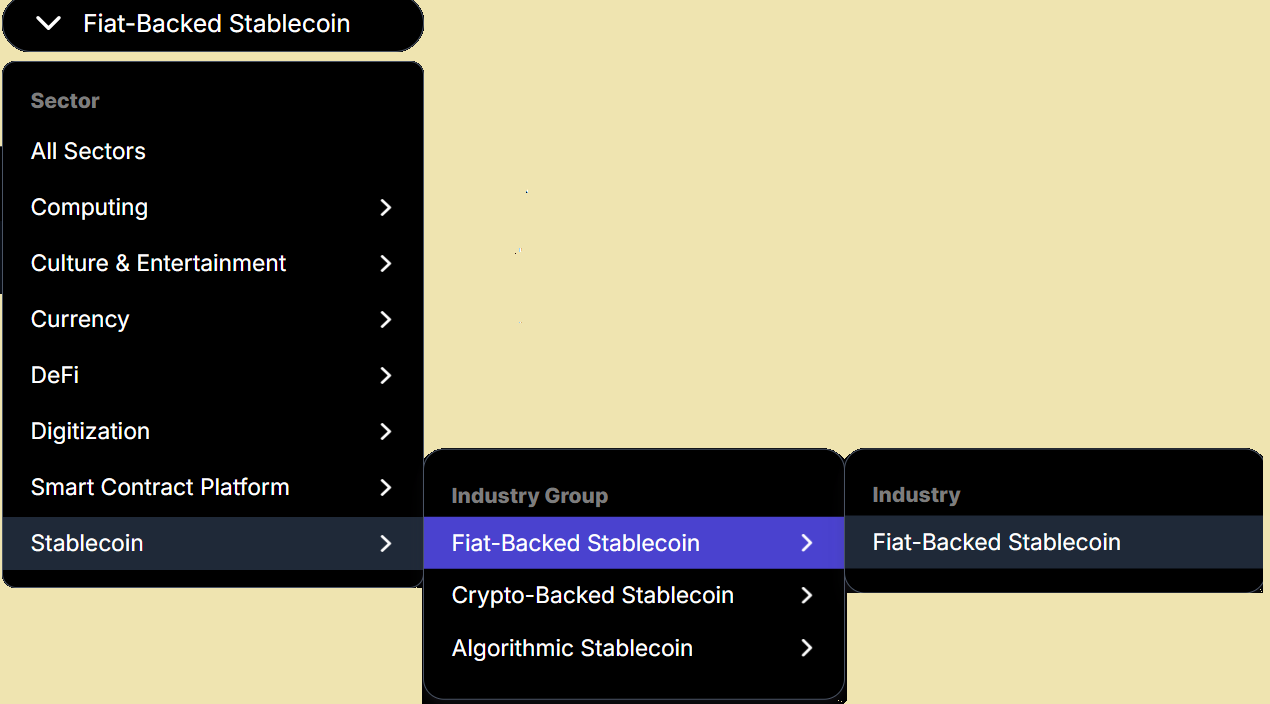
Satellite: Token Metrics - filter by DACS Classification (example: Industry Group = Fiat-Backed Stablecoin)
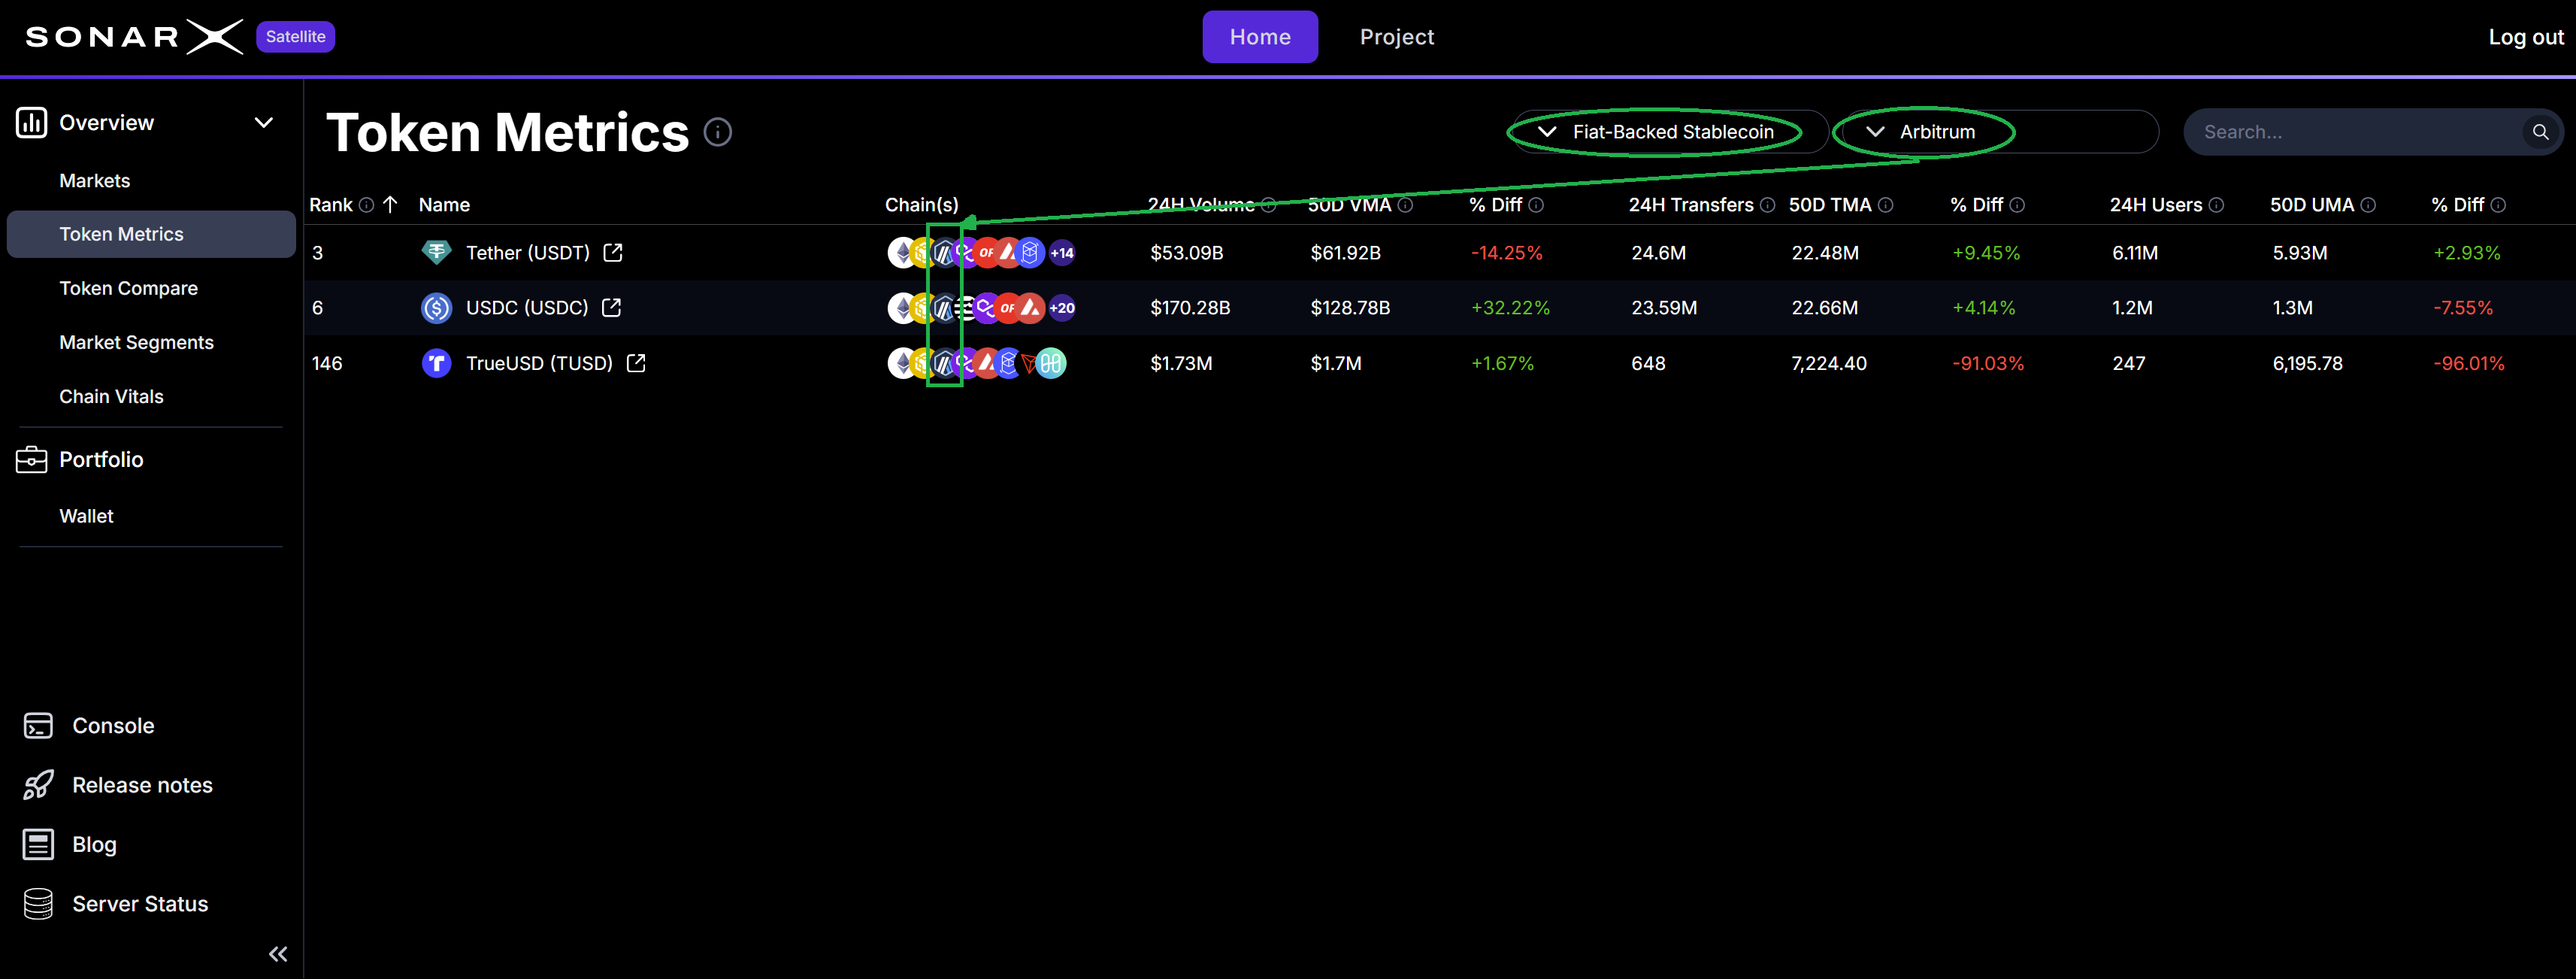
Satellite: Token Metrics - applied filters Chain = Arbitrum, Industry Group = Fiat-Backed Stablecoin
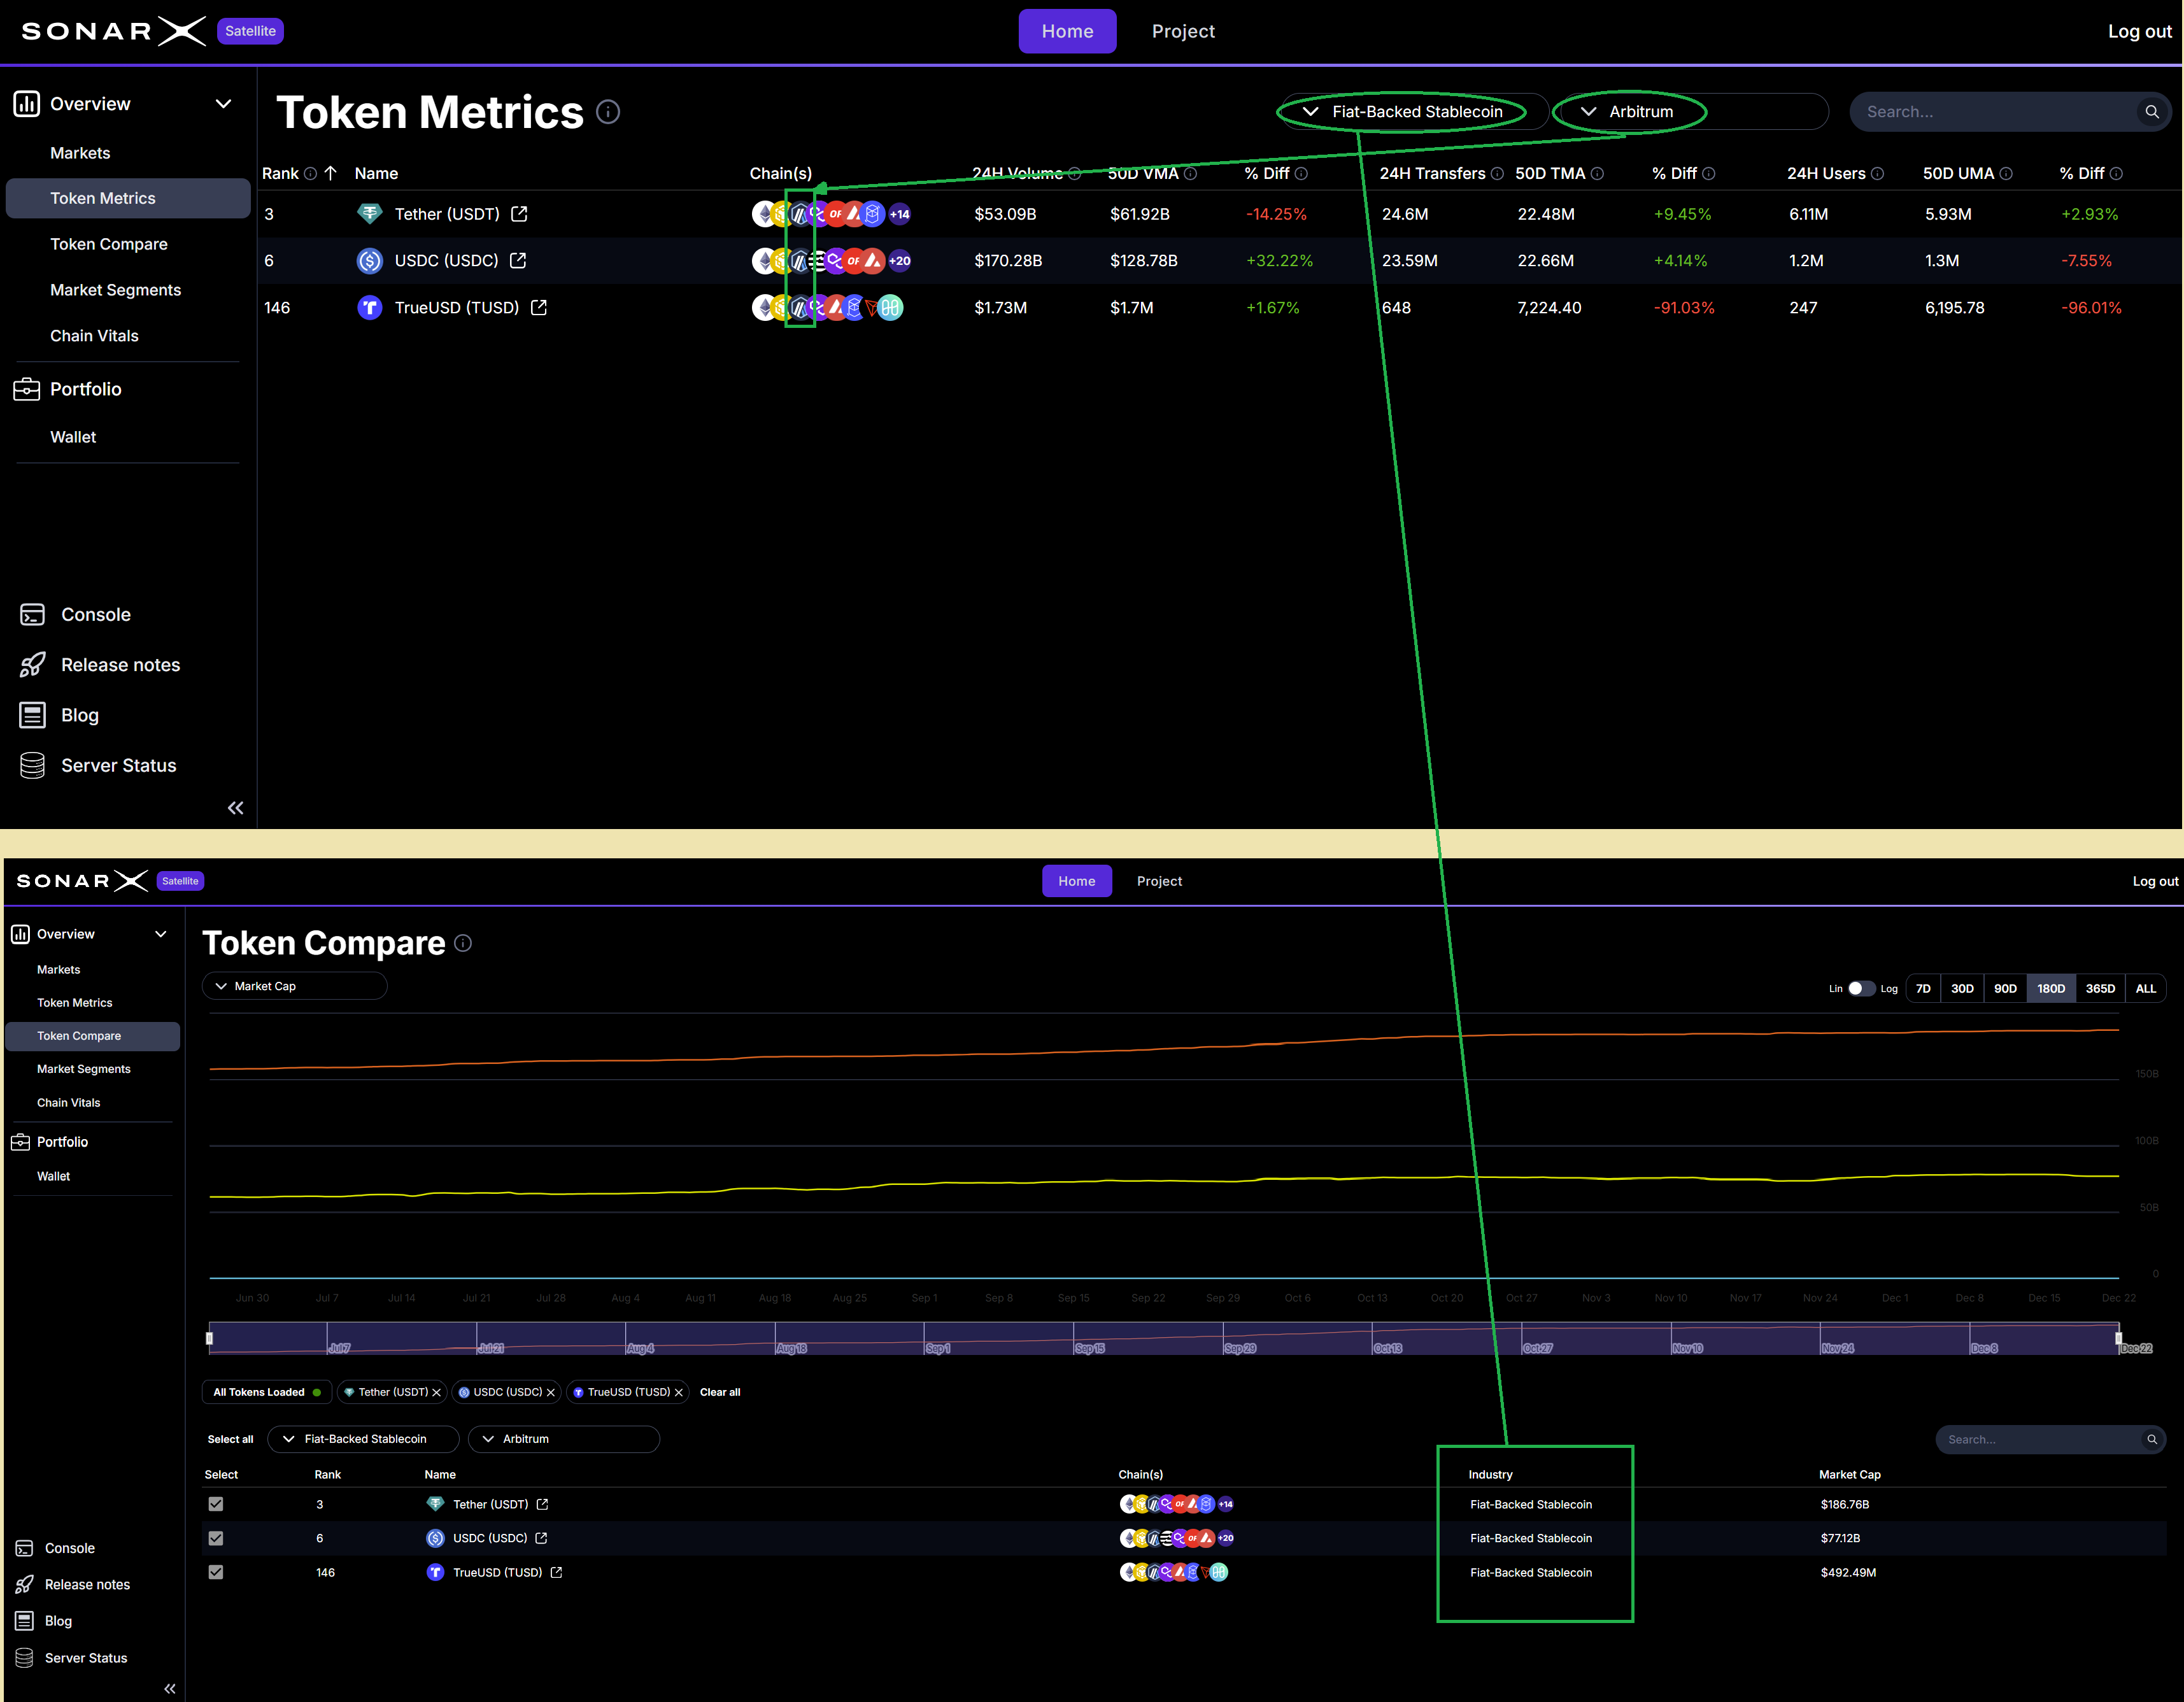
Satellite: Token Metrics --> Token Compare for selected assets where Industry Group = Fiat-Backed Stablecoin
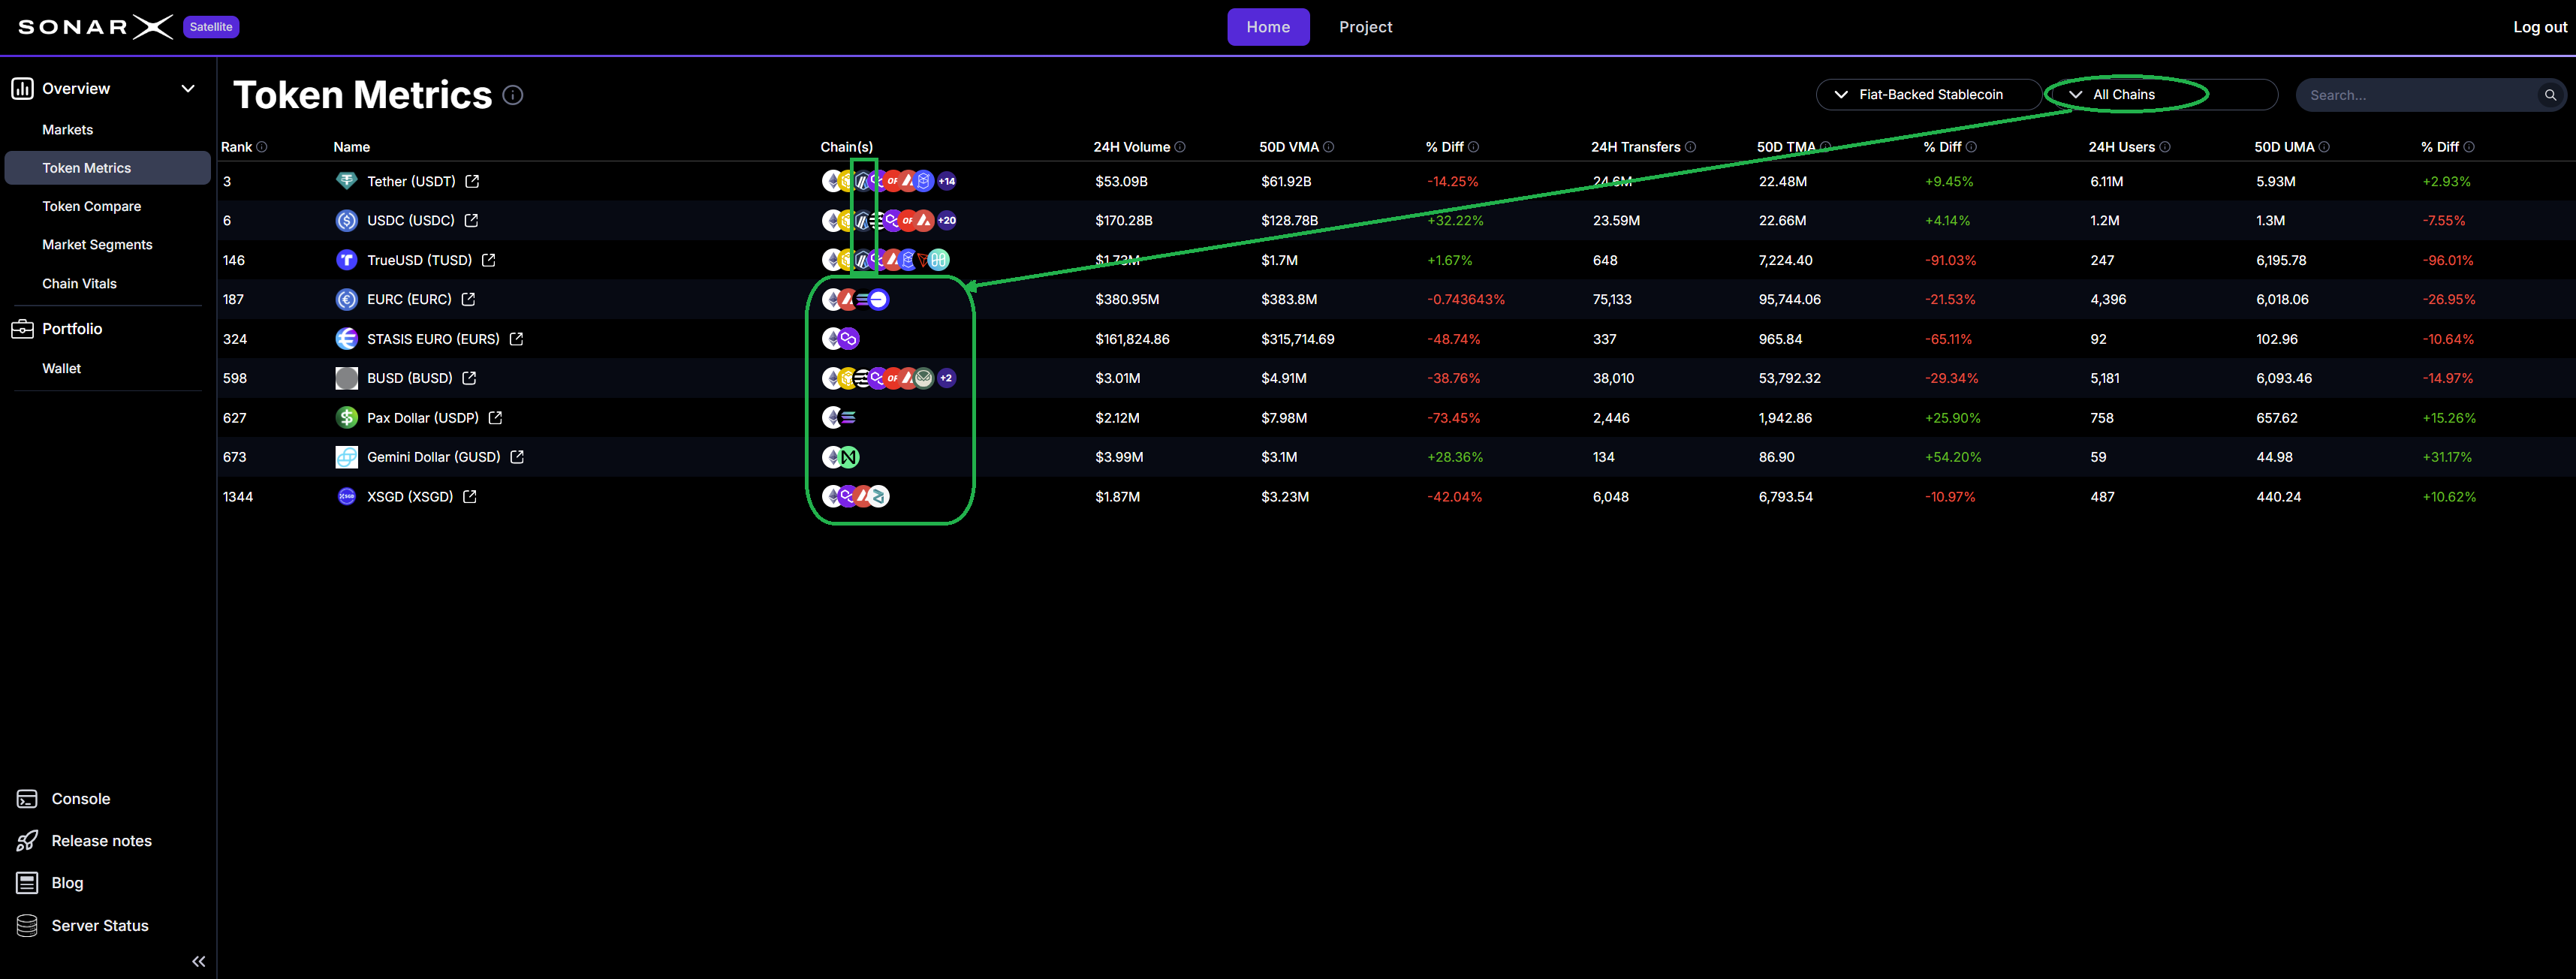
Satellite: Token Metrics - applied filters Chain = All Chains, Industry Group = Fiat-Backed Stablecoin